Pathogenic microorganisms such as bacteria or fungi, can cause infectious diseases. Currently, medications are usually prescribed to cure patients of infectious diseases. Antibiotics are used for the treatment of bacterial infections and antifungals for the yeast caused infections. It is known that bacteria can develop antibiotic resistance while fungi are not sensitive for the treatment by antibiotics and vice versa. In mixed infections, only one domain of pathological microorganism (eukaryote or procaryote) can be killed while allowing another to spread even faster. For this reason, it is important to identify the species of microorganisms early to accurately prescribe the treatment. In the case of fungal infections, it is important to identify the type of the cell death: apoptosis or necrosis. It is known that during necrotic way of cell death the ROS, damaged proteins, toxins and etc are released to the surrounding environment and can cause secondary inflammation. Therefore, apoptotic pathway is not causing the inflammatory effect, opposite, the compounds released from the apoptotic cell can be used by the host epithelium cells for the regeneration. Currently, the identification of bacteria and fungi can take up to three days and the accuracy of the identification ranges from 40% to 100%, while using FTIR ATR spectroscopy, identification can be carried out quickly and more accurately [1-2].
In this work, the method of an attenuated total reflection of infrared radiation (ATR IR) spectroscopy was applied for the analysis. ATR IR absorption spectra of 95 samples of different bacteria (32 samples, 9 different species) and fungi (63 samples, 3 different species) were analysed. The main differences between bacteria and fungi ATR IR absorption spectra were observed in the 1800 cm-1 – 750 cm-1 region. In order to determine how accurately bacteria and fungi ATR IR absorption spectra can be identified, hierarchical cluster analysis (HCA) was performed. HCA was performed using Ward Algorithm, selecting the 1800 cm-1 – 750 cm-1 spectral region. ATR IR absorption spectra of fungi and bacteria were separated into two clusters with 100% accuracy.
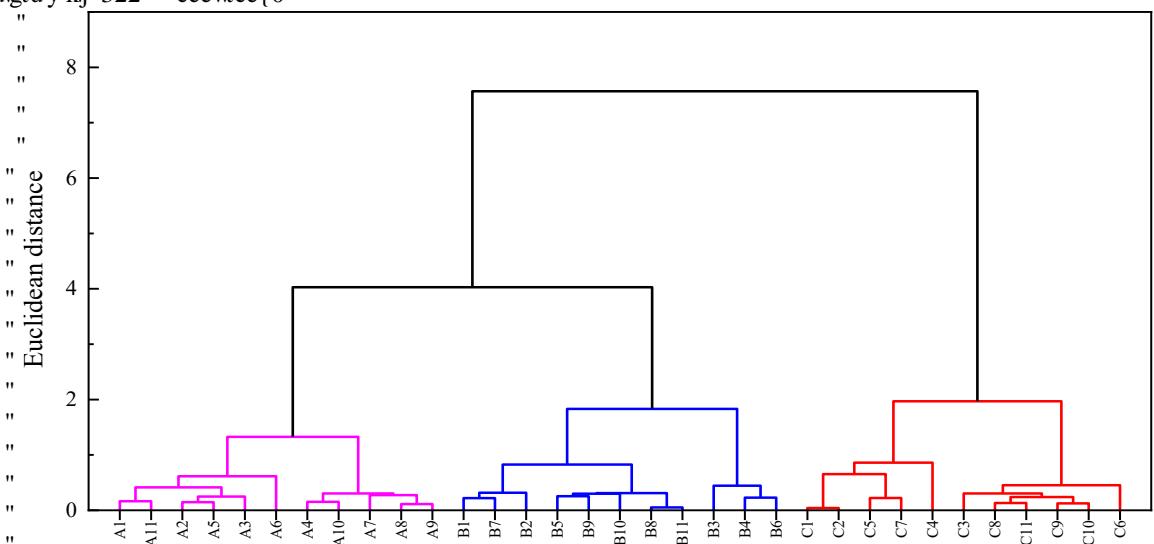
In order to determine Candida lusitaniae fungi death mechanisms HCA was performed. HCA was performed using Ward Algorithm, selecting the 1724 cm-1 – 1535 cm-1 spectral region. This spectral region was selected because the shift of Amide I spectral band at 1637 cm-1 was observed in the ATR IR absorption spectra of damaged by thermal shock C. lusitaniae fungi. HCA showed that ATR IR absorption spectra of undamaged, damaged by thermal shock and UV radiation C. lusitaniae can be grouped into different clusters with 100% accuracy (Fig. 1.).
Spectral differences between ATR IR absorption spectra of different strains of Geobacillus sp. were observed in the 1183 cm-1 – 930 cm-1 spectral range where the intensity of the spectral bands at 1277 cm-1 (proteins), 1382 cm-1 (carbohydrates), 1398 cm-1 (fatty and amino acids), 1440 cm-1 (lipids), 1453 cm-1 (alkanes and acyclic compounds) differ. HCA was performed for the ATR IR absorption spectra using Ward Algorithm, selecting the 1174 cm-1 – 1164 cm-1 spectral region. ATR IR absorption spectra of Geobacillus sp. 612 and Geobacillus sp. 95 were separated into two clusters with 100% accuracy.