
Nonlinear refractive index (n2) describes how the refractive index of a medium depends on the intensity of light. This parameter is responsible for many phenomena of nonlinear optics and in modeling such phenomena it is important to know the most precise value of n2. Popular methods for measuring n2, like Z-scan [1], are based on the assumption that laser beam and pulse profiles are Gaussian. In practice this is sometimes difficult to fulfill, especially in the mid-infrared (MIR) wavelength range between 2μm and 20μm, where there is a shortage of information about n2. Therefore, n2 measurements, with included real spatial and temporal intensity distributions, are of great importance.
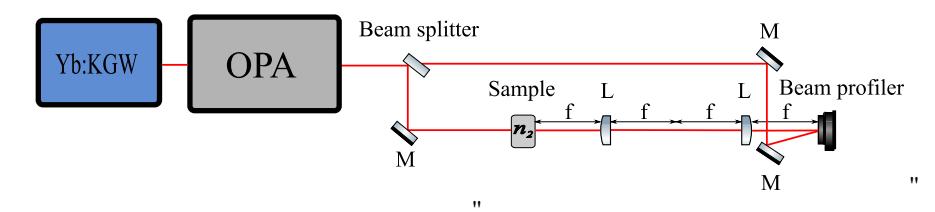
We measured n2 by using an interferometer to detect a total on-axis nonlinear phase shift (B) acquired in a sample and including measured spatial and temporal intensity distributions by numerically simulating the experiment. A simplified optical scheme of the measurement is shown in Fig. 1. For 3240nm light generation we used a label-free optical parametric amplifier (OPA), pumped by a femtosecond Yb:KGW laser “Pharos”. From the interference pattern we obtain a surface of spatial phase difference between two interfering waves by using Fourier transform method [2]. To avoid the effects of linear wavefront distortions we obtain a change of B ($\Delta B$) from a change of two phase surfaces at different pulse energies. Here $\Delta B$ was found by fitting spatial intensity distribution of a beam at the sample to a phase difference surface.
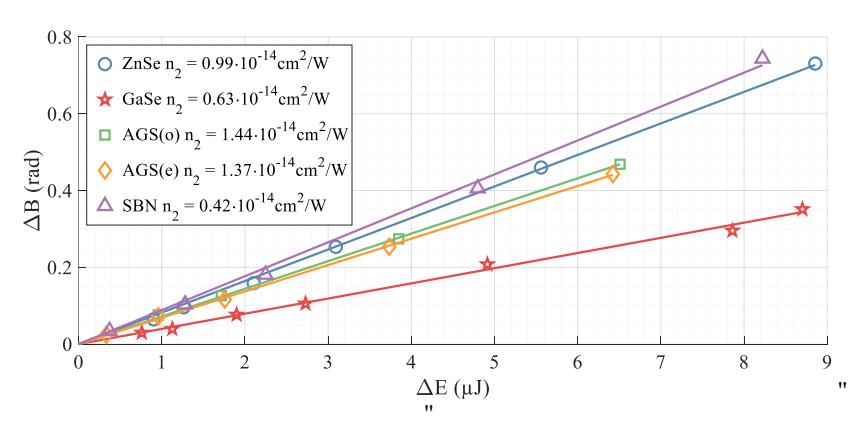
First we successfully [3] measured n2 of fused silica ($2.74 \cdot 10^{-16}$cm2/W) at 1030nm. Then we proceeded to measure ZnSe, GaSe, AGS (using ordinary (o) and extraordinary (e) polarized light) and SBN samples at 3240nm. The results are shown in Fig. 2. The values of $\Delta B$ were obtained at different pulse energy changes $\Delta E$. Obtained $\Delta B$ values were corrected according to the measured pulse shape and the n2 was found from linearly fitted experimental data with a fixed intercept value of zero. Some of our results were similar to the ones given in the scientific literature [4] [5].
In conclusion, we prepared a method to include real temporal and spatial intensity distributions of light in n2 measurements and successfully measured some popular IR materials at 3240nm. This method could be used to further measure n2 in the MIR, where such measurements are needed.