
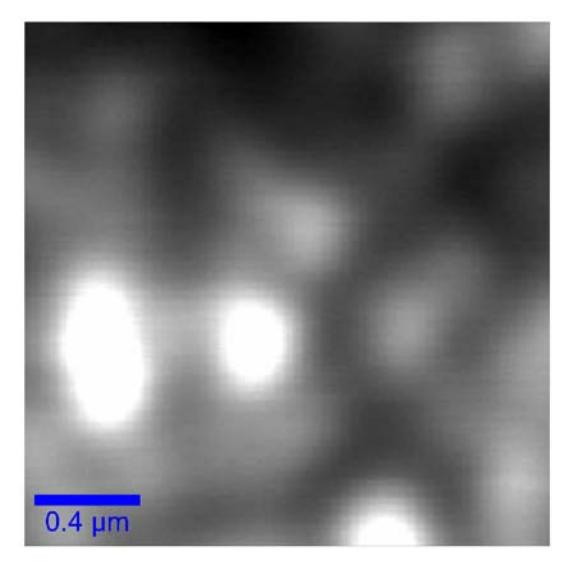
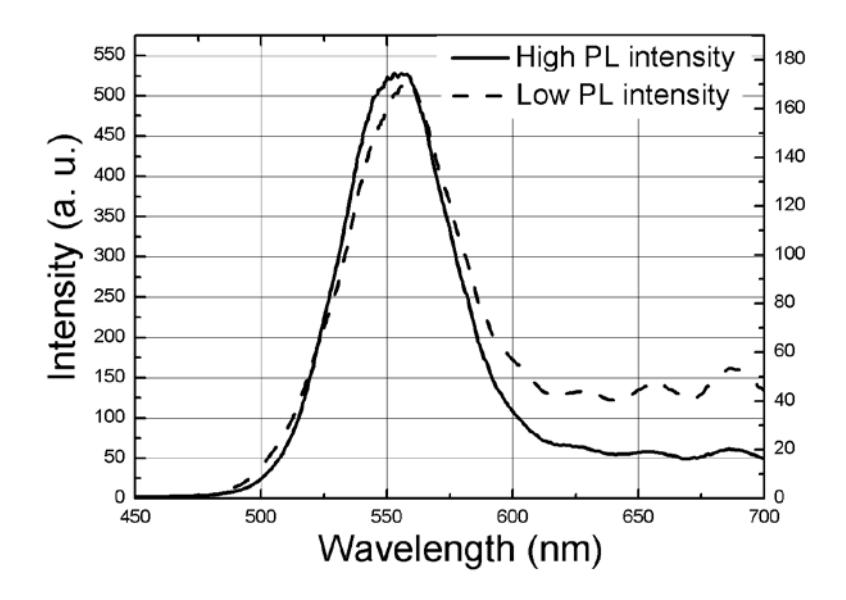
Ternary compounds of InGaN are of great interest for applications in nearly all commercial light emission systems since they allow bandgap tunability from the UV to the visible region of the spectrum [1]. However, their optical properties including radiative recombination peculiarities still need further investigation in order to reveal details of fundamental processes and recombination mechanisms which are far from complete understanding in order to optimize device operation regimes and even to extend their usage. In this paper, investigation of In-rich InxGa1-xN ($x$ is close to ~30%) epitaxial layers grown by MOCVD technique over sapphire substrate was performed using laser scanning confocal microscopy (LSCM) technique. This method provides unique possibility to analyze spatial distribution of photoluminescence (PL) with high (submicron) spatial resolution and to study carrier localization problems. Since the band gap of ternary compound InxGa1-xN depends on In fraction $x$ [1] the near-band edge (NBE) emission spectra can also provide information on In space distribution in the layer. Band gap was determined by wavelength of the PL intensity maximum. These spectra revealed that In concentration is not uniform throughout the sample surface. Besides, PL intensity is distributed non-homogeneously, too. Typical image of spatially distributed PL intensity with high and low intensity areas is illustrated in Fig. 1.
FLUCTUATIONS OF INDIUM CONCENTRATION IN In-RICH-InGaN EPITAXIAL LAYERS
Vilmantas Šukauskas1, Darius Dobrovolskas1
1 Semiconductor Physics Department, Vilnius University, Vilnius, Lithuania
Fig. 1. Image of spatially distributed PL intensity in the area of 2x2μm of InxGa1-xN sample.
Fig. 2. Average spectra of high and low PL intensity areas.
[1] S. J. Pearton, J. C. Zolper, R. J. Shul, and F. Ren, J. Appl. Phys. **86**, 1 (1999).
[2] www.semiconductors.co.uk