
The value of the radio refractive index (the ratio of the radio wave propagation velocity in free space to the velocity in specified medium [1]) depends on the atmospheric pressure, temperature, and relative humidity. Even small changes in the meteorological parameters mentioned above may affect the radio wave propagation, because the signal can be refracted by many times over the entire track in the locality [2]. The electromagnetic wave path becomes curved because the wave encounters variations in the atmospheric radio refractive indices along its trajectory [1].
In Lithuania, the values of the temperature, relative humidity, and atmospheric pressure vary from place to place and in the time. Therefore it is important to analyze the changes in the radio refractive indices both in the localities of Lithuania and in time.
The value of radio refractive index is very close to the unit and the changes in this value are very small in time and space. With the aim of making them more visible, the term of refractivity $N$ is used [1], [3]–[4]:
$$N = (n-1) \times 10^6,\tag{1}$$
According to [4]:
$$N = \frac{77.6}{T} \left( p + 4810 \frac{e}{T} \right),\tag{2}$$
where $T$ (K) is temperature; $p$ (hPa) is the atmospheric pressure: $e$ (hPa) is the partial water vapor pressure.
The relationship between $e$ and the relative $H$ (%) is [1], [3]:
$$e = \frac{He_s}{100} \,.\tag{3}$$
In the localities of Lithuania (Vilnius, Mažeikiai, Kaunas and Klaipėda), the values of the radio refractivity $N$ have been determined by using Eqs. 1–3. The meteorological data (taken from http://www.rp5.ru/archive.php?wmo_id=) of the years 2008 and 2009 have been used. It was concluded that the time responses of $N$-values averaged over the month are near the same in Vilnius, Mažeikiai, and Kaunas (in Continental Part of Lithuania) and it is different from ones in Klaipėda. Therefore, the data obtained in Vilnius and Klaipėda has been analyzed (see Fig. 1.) in more detail. The $N$-values were averaged over two years (2008 and 2009).
The data presented in Fig. 1 show that the highest values of $N$ were in July in both localities mentioned above. The maximum $N$-value of $N$ = 350.1 $N$-units was observed in July 2009 and the minimum one of $N$ = 312.8 $N$-units was in Vilnius in October 2009.
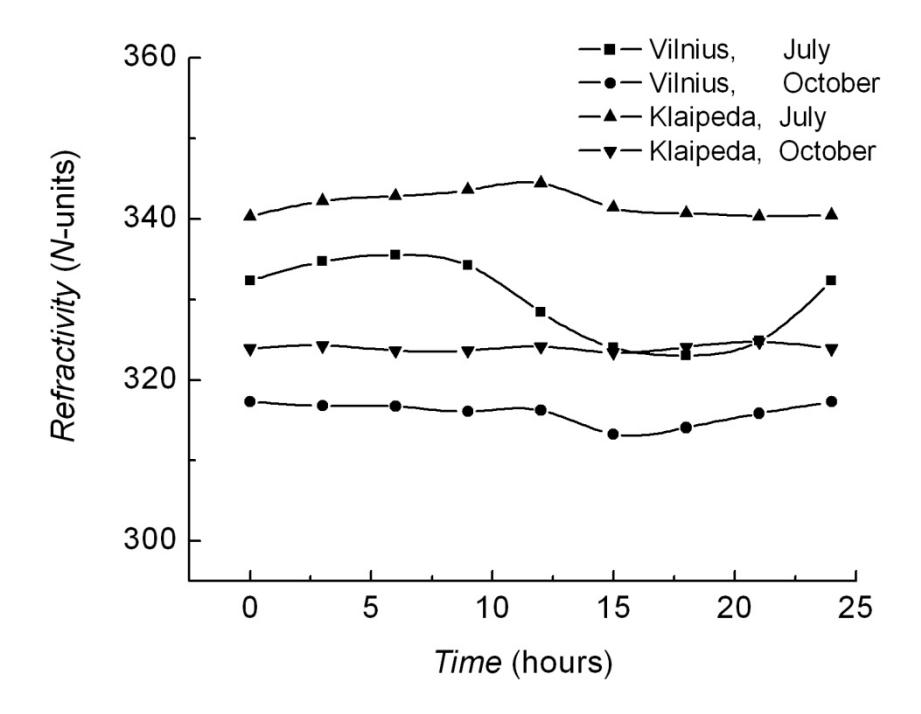
More noticeable variations in the radio refractivity values were observed in July in both localities: ($\Delta N$ =12.5 $N$-units in Vilnius and $\Delta N$ =4.1 $N$-units in Klaipėda). In October, $\Delta N$ =4.1 $N$-units in Vilnius and $\Delta N$ =12.5 $N$-units in Klaipėda. The minimum values of $N$ were in the afternoon in Vilnius. The variations in the radio refractivity values are negligible in Seacoast (due to the influence of Baltic Sea) and more noticeable in Continental Part of Lithuania.