Researchers have been interested in defects of semiconductor materials for a long time now, because of their strong correlation to the electrical and mechanical properties of a given material. In indium gallium nitride (InGaN) structures, prominent features are V-shaped pits (V-pits), that form due to threading dislocations which propagate to the quantum well layers that are rich in indium. In this work we focus on cathodoluminescence peak wavelength shift of these V-pits and their locale.
To analyze said structures a custom Python code was written and used in combination with Attomap software. Since we are using hybrid cathodoluminescence and scanning electron microscope (SEM-CL), we get both CL and SEM images of the same area. While SEM lets us see sample topography, CL images each pixel has a whole cathodoluminescence signal spectrum, therefore by fitting Gaussian fit on the main signal peak, we can determine at what wavelength the peak sits. Doing this to all image pixels gives the same image but with each pixel having a peak wavelength associated with it. We call it peak wavelength shift (PWS) map, which lets us see how CL signal peak shifts in a sample.
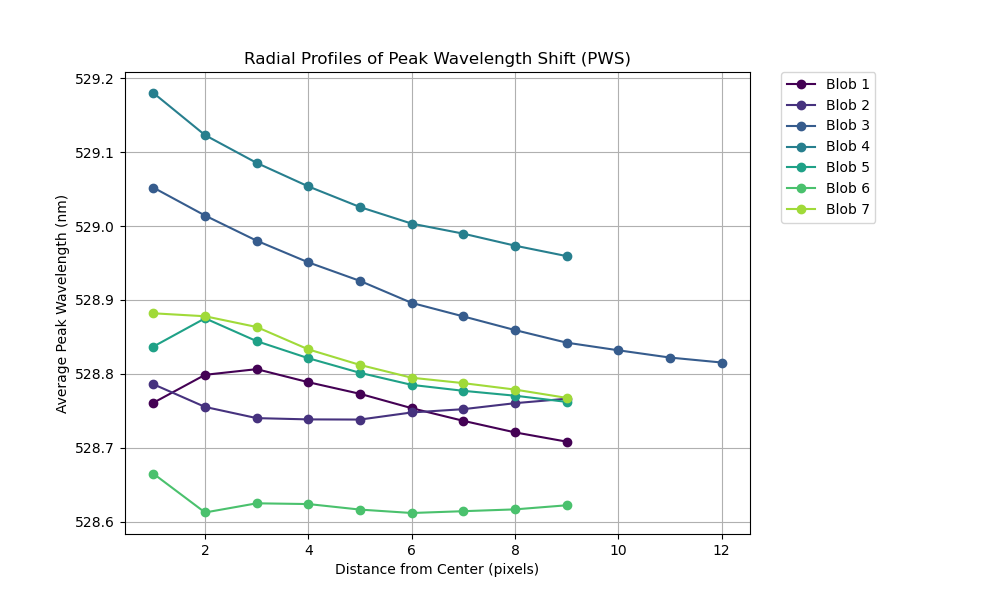
Secondly, we detected V-pits using Laplacian of Gaussinan (LoG) filter on SEM images. Since SEM and now generated PWS image areas are the same, we can directly transfer detected V-pits onto PWS image to start the analysis. By knowing the center coordinates and sizes of V-pits in PWS image, we can calculate how the CL peak shifts going outward in a radial pattern from the defect center. Plotting average values of each circle’s circumference from V-pit center gave us radial profile of peak wavelength shift. To achieve statistically significant results, we performed this process for all detected V-pits in each image from measured samples and averaged them again across the whole image. An example radial profile of all detected V-pits in an image is shown below.