Star clusters and knowledge of their physical parameters (age, mass, metallicity, extinction) provide an excellent insight into the formation and evolution of their host galaxies, as most of the star formation happens in clusters. A powerful method allowing parameter derivation for a large number of clusters in the Local Universe (\(\leq\) 10 Mpc,) is fitting their aperture photometry measurements to stochastic theoretical models [1]. Therefore, it is highly important to understand methodś limits in order to not over-interpret the data as we attempt to unravel formation histories of nearby galaxies.
The aim of this study is to estimate maximum possible accuracy of the aperture photometry methods for star cluster studies in the Local Universe. We simulated an extensive (500 nodes) grid of 3D cluster models covering the parameter space of real objects in the Andromeda galaxy (M31). Each node, defined by initial mass, age, and geometric parameters, contains 100 stochastic 3D models. Cluster CCD images were generated in 6 photometric (HST) passbands by taking 100 2D projections of each model, mimicking observations from 100 viewing angles. We modelled clusters to match the real ones in M31 as seen in the PHAT survey [2]. We measured simulated images by using aperture photometry method [3] and ran cluster classification tests [1].
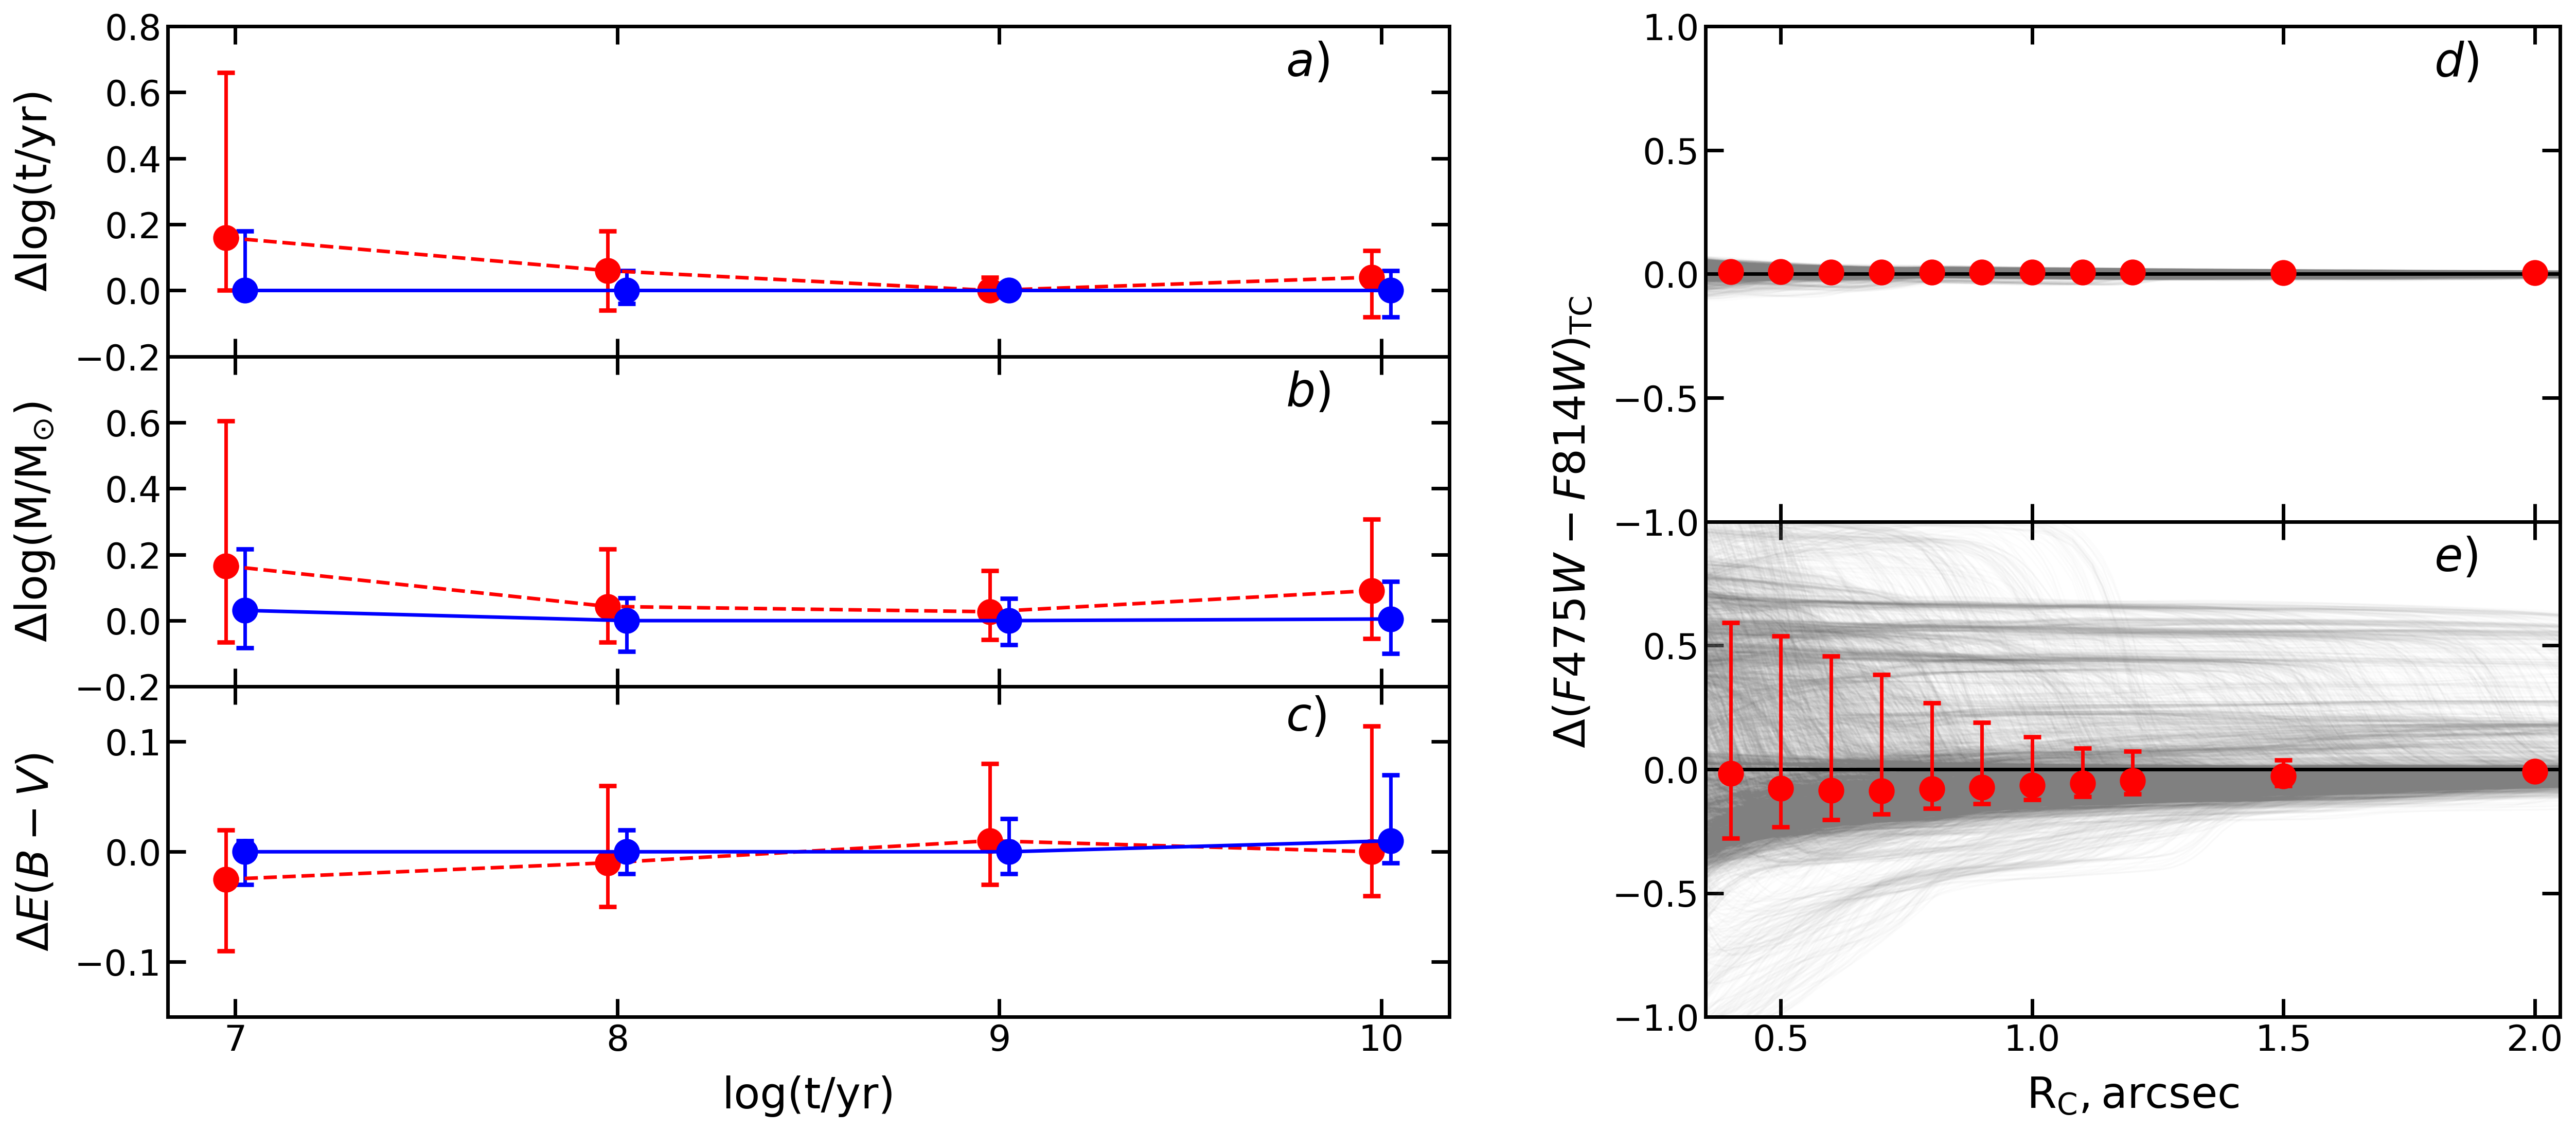
We have demonstrated that using small apertures(\(\rm R_{ap}\) \(\leq\) 0.5 arcsec) is not advisable as it leads to large physical parameter derivation uncertainties (Fig. 1a-c). This supports an idea suggested in [3, 4] that apertures larger than cluster half-light radii must be used to provide robust results. Aperture-photometry-based classification encounters problems at very young cluster ages (\(\sim\)10 Myr), showing large errors (Fig. 1a-c). Using colour-magnitude diagram fitting methods [5] is advised to yield more accurate cluster parameters at ages of \(\sim\)10 Myr. We have shown that there are no significant systematic colour index differences when clusters are measured using smaller apertures (Fig. 1d-e), justifying the adaptive aperture photometry method [3, 4].