
Terahertz (THz) radiation (1012 Hz) is electromagnetic waves lying in frequency range between microwaves and far infrared. THz radiation can be used for material composition and/or quality inspection. Recent work [1] shows that THz radiation could be used for explosive and drug detection as well as an efficient various packages screening. In this work THz transmittance of the sucrose and tartaric acid was investigated, THz imaging at selected frequencies was performed.
The investigated materials were sucrose (SC) and tartaric acid (TA) exhibiting partial transmittance in THz frequency range. The samples were prepared by mixing materials with polytetrafluoroethene (PTFE) powder and subsequently forming pellets of 1.4 mm thickness and 13 mm diameter under application of pressure. In this way it was fabricated three pellets consisting of 10% SC, 10% TA, and mixture of 5% SC and 5% TA, and one pellet - of pure PTFE. To determine possible frequencies for THz imaging, the pallets with SC and TA spectra were measured with a resolution of 1 cm-1 by means of vacuum Fourier spectrometer operating as ordinary Michelson interferometer. The transmittance spectra from 0.6 to 5.7 THz are shown in Fig. 1a. The PTFE itself has no absorption features but SC and TA demonstrate several absorption lines. The strongest lines for the SC are at frequencies of 61.0, 87.9, 114.7, 141.8 cm-1, while for the TA – at 36.5, 87.9, 100.1, 121.8, 136.6 cm-1. Available THz laser lines (46.6 cm-1 and 61.3 cm-1) are also indicated in the spectrum by arrows. For THz imaging one can use them due to distinctive SC peak at 49 cm-1 and peak at 61 cm-1 in which TA has stronger absorption.
The spatial pattern of material in each sample was investigated via active THz imaging technique. Experiment setup is shown in Fig. 1b. THz image of the object was recorded by moving sample with a constant speed in focal plane (XY) of parabolic mirror M2 and at the same time measuring sample's transmittance. Fast raster scanning technique with position synchronized measurement was developed to reduce imaging time. Using this method image recording time depends on imaging area, sample translation velocity and desirable resolution. For example, it takes about 5 minutes to record an image of size 6x3.5 cm2 with 0.03 cm resolution, when object's translation velocity and measurement period is of 6 cm/s and 5 ms, respectively.
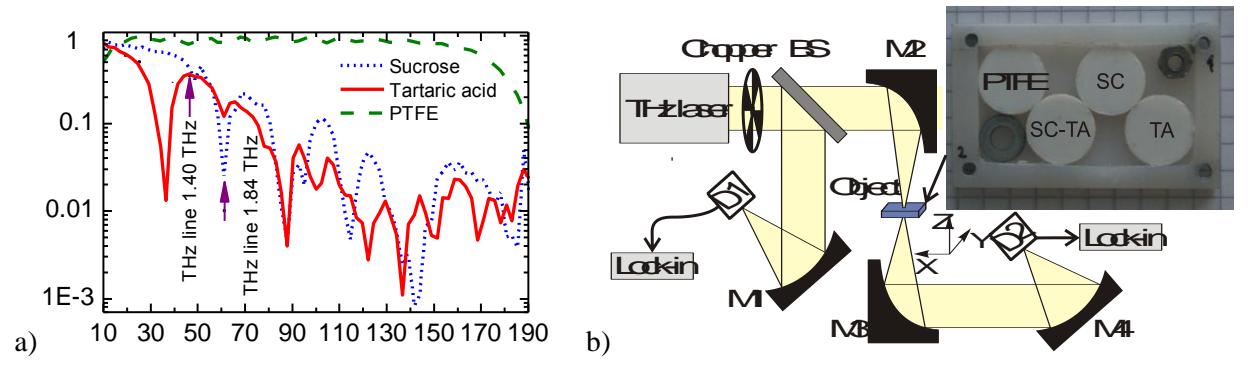
Prepared four sample pellets together with two metal washers were enclosed in a plastic box made of HDPE, which is opaque for visible light but not for THz. The THz images of the box at 1.40 THz and 1.84 THz are shown in Fig. 2. In THz light the box content is screened. At both frequencies the pellet of PTFE exhibits highest transmittance in comparison to others. However, the pallets with SC and TA which have different transmittance (see also Fig. 1a) behave differently. In the image taken at 1.40 THz, the pellet with SC is brighter (higher transmittance) as compared to the pellet with TA and conversely in the image recorded at frequency of 1.84 THz. The pellet with mixture of SC and TA is always in between. In such a way THz imaging allows us to distinguish pellets with SC, TA, and mixture of both. Additionally, the material distribution in the pellets can also be inspected which appears as spots of smaller transmission in the pallet area.
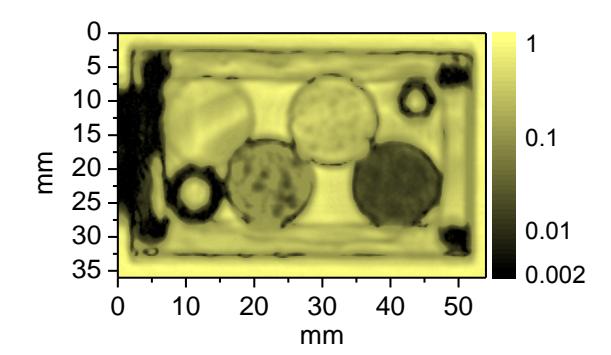
To summarize, in this work we measured transmittance spectra of the sucrose and tartaric acid in frequency range from 0.3 to 5.7 THz. The THz imaging of the pellets with different content of sucrose and tartaric acid were performed at properly selected frequencies.