
Recently, wide band-gap semiconductor ZnO attracts a lot of attention because of its potency to be used for the production of cheap and efficient optoelectronic devices. The incorporation of MgO into ZnO gives a possibility for band-gap engineering in range from 3.4 eV (band-gap of ZnO) to 7.8 eV (band-gap of MgO). For the meantime, the growth of MgZnO layers is difficult because of low thermodynamic solubility of MgO in ZnO. However, recent works show a high improvement in growing techniques for MgZnO layers. Despite the difficulties to grow good quality layer it was reported that MgZnO shows better photoluminescence (PL) efficiency compared to pure ZnO [1] and it was explained [1,2,3] by assuming that the exciton localization processes take a place in MgZnO because of inhomogeneous spatial distribution of Mg concentration. Finally, according to the recent research, MgZnO shows high potential to become extensively used material for production of the optoelectronic devices where wide band-gap semiconductor is required.
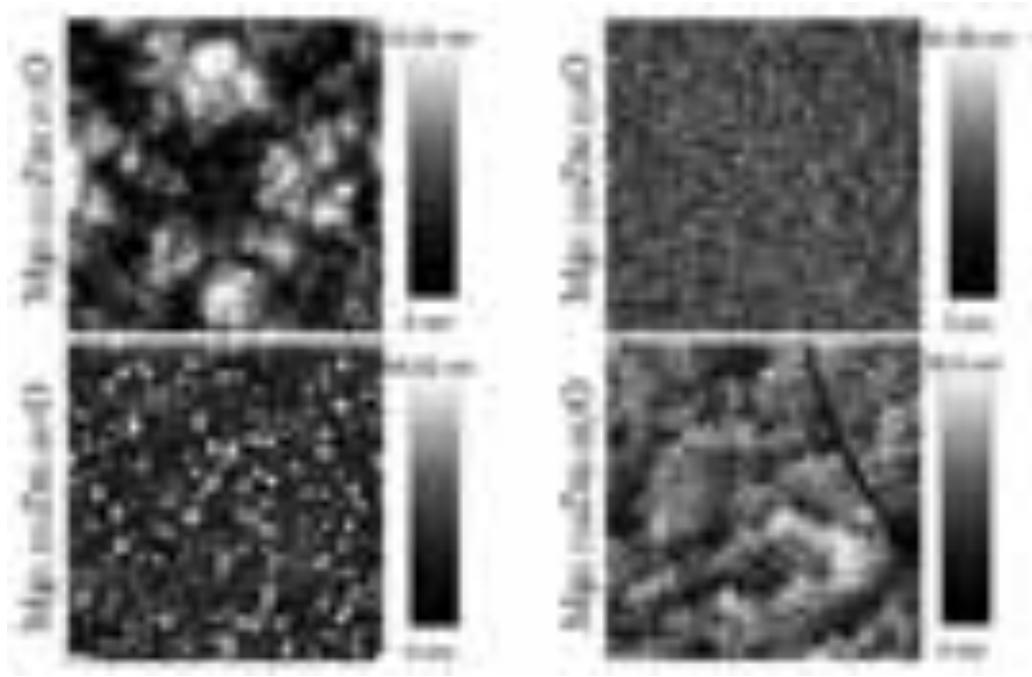
In this work, a series of MgxZn1-xO epitaxial layers with different Mg mole fraction ($x$ = 0.025; 0.166; 0.303; 0.318) grown by MBE has been investigated. Time-resolved photoluminescence (TRPL) measurements and scanning near field optical microscopy (SNOM) technique have been implemented in order to obtain PL spectra and decays as well as spatial distribution of the PL intensity and peak wavelength. Atomic force microscopy (AFM) technique has been chosen to evaluate structural properties. Images of epitaxial layer surface profile (Fig. 1), obtained by AFM technique, have revealed distinct characteristics for all samples and a strong surface roughness dependence on Mg concentration.
Time-resolved PL decays have revealed a biexponential shape for all four samples at low temperatures. Three samples with the highest Mg mole fraction show an increase of the PL decay time at low temperature. Arrhenius plots for the PL intensity dependence on temperature have been drawn and parameters have been extracted. Samples with higher Mg mole fraction show higher value of activation energy. The PL mappings, obtained by SNOM technique, have revealed considerable spatial variation of PL intensity, peak wavelength and FWHM. However, the correlation between PL intensity and peak wavelength are negative and it contradicts to the usual exciton localization model providing positive correlation between those parameters. The possible reasons of this phenomenon are discussed.