Recent technological progress in light emitting diodes (LEDs) opened the way for using them in various applications where various emission wavelengths and/or emitter's high-brightness are of vital importance. Photovoltaic (PV) devices are in turn increasingly used in energy generation. Although these devices are widely investigated separately both devices are based on pn junction physics. Due to this fact, improvements of both devices are expected by investigation only one of them.
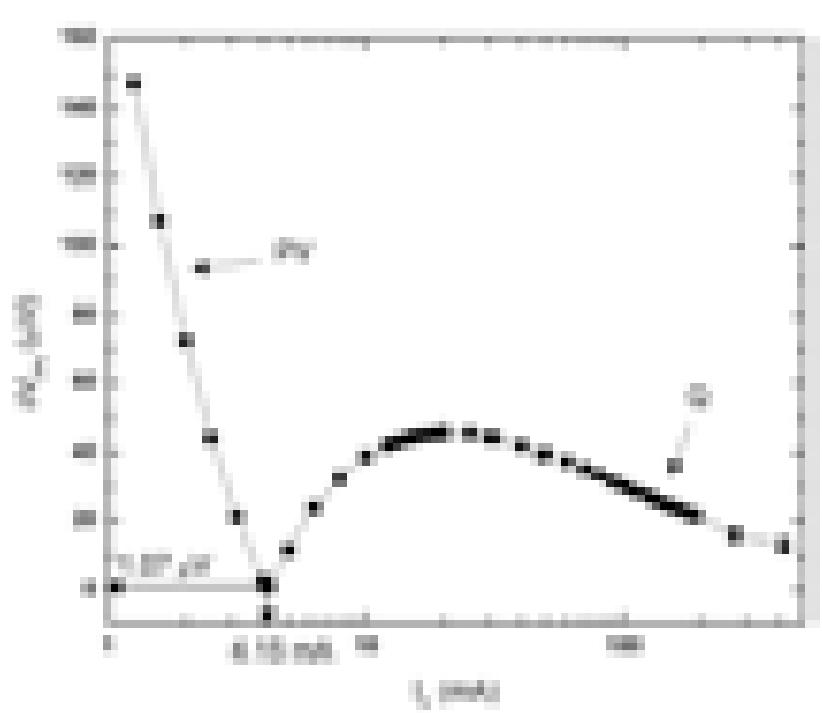
Here we report on the technique for the investigation PV effect versus heating. By taking into account these competing effects, we demonstrate an easy method for the LED characterisation and the evaluation of thermal constants. A commercial high-power (1 W) red AlGaInP LED (Philips Lumileds Lighting model MD1D) was investigated. The LED was driven by a source meter (Keithley 2430) in dc range of 10 nA to 1 A. During the measurements LED was attached to a heatsink and was illuminated by the second commercial high-power (1 W) red-orange AlGainP LED (Philips Lumileds Lighting model MH1D), that was driven by a sinusoidally modulated current with the bias somewhat below than the nominal current I0 = 300 mA and modulation depth mI = 20%. Modulated current was provided by a custom made operational current amplifier, which was driven by a function generator (Tektronix AFG-3252). A digital lock-in amplifier (Signal Recovery model 7265) was used for detecting the respond signal on the first LED and measuring the amplitude and phase of the forward voltage variation. The zero photovoltaic effect was investigated at various frequencies, where the major of them were 0.25 Hz and 50 kHz. This range of frequencies spans from below to above the thermal cutoff (a frequency when junction temperature oscillation vanishes, 4.3 kHz for the model MD1D) of the LED. Figure 1 depicts the experimental data of the first measurement.