
Carbon structures are very perspective and important materials in the field of physics, chemistry, medicine and material sciences. Nowadays science still faces a problem identifying various carbon structures in mixture samples. Therefore the goal of this project is to investigate main carbon structures: diamond, graphite, fullerene, multi-walled carbon nanotubes (MWCNT), single-walled carbon nanotubes (SWCNT), and functionalized carbon nanotubes with hydroxyl group by the means of FT-Raman spectroscopy in order to find a suitable experimental technique to identify various carbon structures in their mixtures. Conventional Raman spectroscopy is difficult to apply to study carbon structures due to the fact that in many cases the Raman spectra are disturbed by strong fluorescence background. FT-Raman spectroscopy with NIR excitation is easy, fast, cheap and precise method to study such complicated structures [1]. In FT-Raman spectrometers Nd:YAG laser (1064 nm) is usually used for the Raman excitation, the photon energy is too low to excite fluorescence. High sensitivity, high speed and possibility to average high number of spectral scans allow to observe even very weak spectral bands in the FT-Raman spectra.
The samples were prepared using “pallet” technique (except diamond crystal). Carbon materials were mixed with potassium-bromide (KBr) powder in proportion of 1:5000 and mechanical pressure of 10 ton per cm2 was applied. Measurements were performed using a FT-Raman spectrometer MultiRAM from “Bruker”. The spectra were measured in range of 3600 to 50 cm-1. Raman spectra of various carbon structures are presented in figure 1.
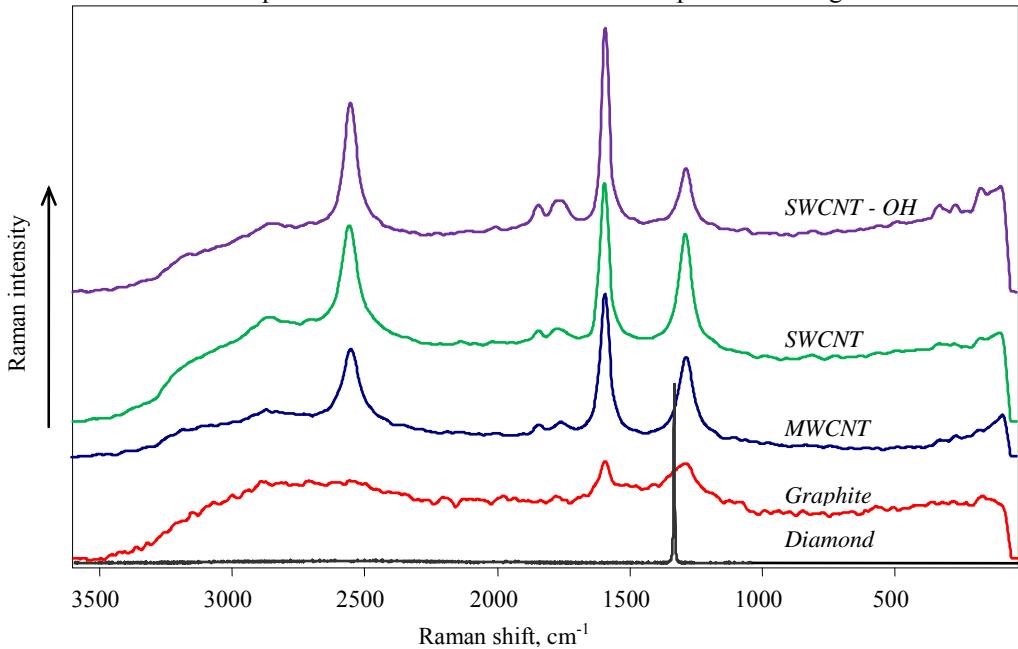
As can be seen in the figure, pure diamond has a very intense narrow band at 1332 cm-1, because of its highly ordered structure. Graphite has two weak bands at 1285 cm-1 and 1589 cm-1 [2]. The same bands are observed in the spectra of nanotubes, but being much stronger than in graphite. The band at 1589 cm-1 seems to be the most important one for characterization of carbon nanotubes. The band localized at 2551 cm-1 also is characteristic for carbon nanotubes and is attributed to the first overtone of 1589 cm-1 band. A low-frequency weak band at 171 cm-1 is attributed to the breathing mode (RBM – radial breathing mode) of nanotubes [1]. This spectral band is often used to determine the length to radius ratio in nanotubes under study.
Our results show that FT-Raman with NIR excitation spectroscopy can be efficiently used for qualitative and quantitative analysis of various carbon compounds.