We present results of spectroscopic ellipsometry (SE), a nondestructive optical technique, study of the natural oxide surface layers of icosahedral ZnMgRE (RE = Y, Ho, Er) single-grain quasicrystals. Samples were grown by the liquid-encapsulated top-seeded solution-growth method [1]. After an optical surface preparation by mechanical polishing, the samples were naturally oxidized under normal atmospheric ambient. The spectroscopic ellipsometry measurements in the spectral range 0.73 – 6 eV were carried out by the dual rotating compensator ellipsometer RC2 (J. A. Woollam Co, Inc.,) in steps of 1 nm at 45, 55, 65 and 75° of the incident angle. The measured SE spectra were analyzed by several fitting models, which construction was based on the X-ray photoemission spectroscopy (XPS) depth profile measurements. The XPS measurements were carried out by VG Scientific ESCALAB MK II spectrometer equipped with Al Kx (1.487 keV) X-ray source.
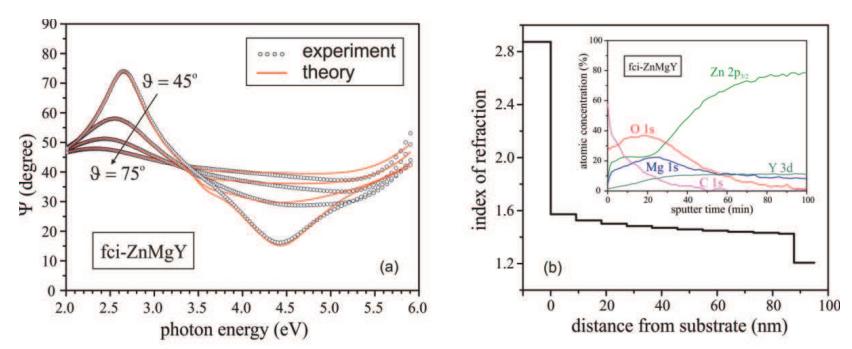
The experimental spectra of ellipsometric parameters [Fig. 1(a)] show that the optical response of naturally oxidized ZnMgRE quasicrystals manifests distinct features due to an optical interference in semitransparent film. In the analysis of the SE data, a native oxide layer was described using the Bruggeman effective medium approximation (EMA) [2] by modeling the layer as a physical mixture of three distinct phases: zinc oxide, magnesium oxide and ZnMgRE quasicrystal. The refractive indices of ZnO and MgO were taken from literature [3]. Optical constants of ZnMgRE quasicrystals were determined from the same samples after careful removal of native oxide films by combined mechanical polishing and plasma etching technique.
The ZnMgRE surface layer is inhomogeneous, its refractive index profile varies with depth according to XPS data. The XPS depth profile [Fig. 1(b) inset] clearly shows the inhomogeneous profile of atomic composition (measured at different sputter times). In modeling of SE data, we used the grading model in which the relative fractions of ZnO, MgO and ZnMgRE optical parameters were varied along the surface normal. The graded layer was divided into numerous sublayers of equal thicknesses. Each sublayer was assumed to have a uniform composition, its variation from one sublayer to another was assumed to have a linear staircase profile. The graded model suggested a remarkably good fit over an entire spectral range and for all incident angles [Fig. 1(a)]. This allowed to reliably determinate the thickness of the layer thicknesses and the refractive index profile [Figure 1(b)]. The index profile determined by SE analysis was found to be consistent with the XPS atomic composition profile.