
Wide band-gap materials such as GaN and InGaN are very attractive because of their suitability for the fabrication of high efficiency light-emitting devices (LEDs) used for various applications including general lighting. The main part of led structure is multiple quantum wells (MQWs) which emits light. The radiation wavelength emitted from InGaN multiple quantum wells can be varied in wide visible and UV region by changing indium content [1].
One of the most convenient ways to analyze MQW structure is High Resolution X-Ray Diffraction (HR XRD). Information about the number of quantum wells, indium content, the well and barrier thicknesses interface and crystal quality can be extracted from XRD rocking curve measurements. Some of parameters could be obtained by measuring simple measurement of angular distance between XRD peaks, but usually sophisticated modeling is applied for simulation of whole XRD curve for simultaneous extraction of the set of parameters.
In the part of paper we will present modeling of XRD (002) rocking curves in order to show how different parameters of MQW structure influence the shape of rocking curves. Scattering from MQWs can be understood by analogy to scattering from an optical grating, where the number of thickness fringes is related to the number of repeats. The number of smaller fringes depends from the number of wells, the distance between bigger fringes depends from one well and one barrier structure thickness, between smaller fringes – from all wells and barriers overall thickness. The position of zeroth order peak (on the left from GaN peak) depends from well and barrier thickness, but mostly from indium content [2].
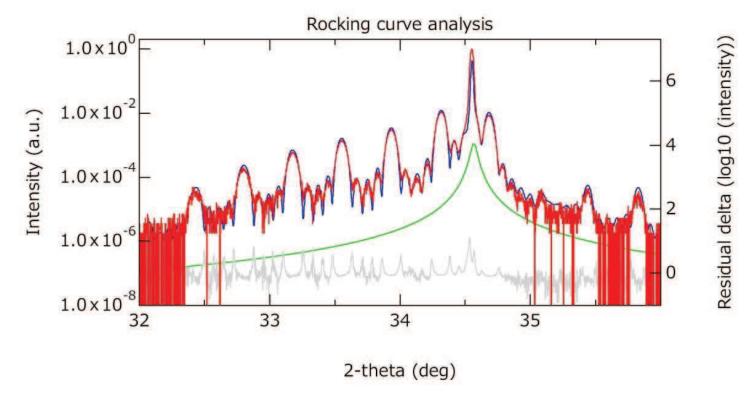
The (002) rocking curves were measured and modeled for the series of MOCVD grown InGaN/GaN MQWs with different In composition (Fig 1). The indium content in quantum wells was compared with data obtained by photoluminescence (PL). The clear correlation was obtained between two methods, although exact indium content values showed significant discrepancy, what was explained by nonrectangular In concentration profile in QWs.