
In Lithuania more than 50% of human deaths are caused by cardiovascular diseases [1]. This trend continues to dominate in the EU countries as well. "Eurostat Database" data for 2010 shows that mortality from ischemic heart diseases was 76.5 deaths per 100,000 of population [2]. It is essential to discover more efficient tools for making more accurate and precise diagnosis as well as monitoring methods for cardiac and circulatory system diseases in order to observe their progress.
The aim of this research was to develop a program being able to process and analyse the fluctuations of signals generated by heart and circulatory system in purpose to discover a special testing methodology for human limb impedance signal.
The signal of cardiac and circulatory system is usually measured using electrodes [3]. In this work an optical method is used to investigate signals generated by blood flow. A light emitting diode and a photodiode were placed in a light-tight chamber, a human limb (in this case – a finger) is placed in-between. The signal is acquired by measuring the fluctuations of transmitted light through the finger.
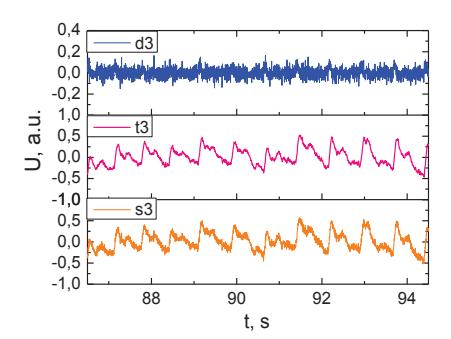
The program was built using this algorithm: Scanning of digitized signal. Eliminating of 50 Hz and more than 100 Hz frequency components. Centring of the signal. Processing by the method of moving averages. Subtracting centred signal from the primary measured signal. Computing a correlation function and a power spectrum. Entering data into text documents.
The test run showed that all the subjects had heart rate variations between 1.37 Hz and 1.63 Hz (Fig. 1).
Apparent respiratory frequency can also be obtained from measured signals – it corresponds to 0.1 Hz - 0.5 Hz frequency. The respiratory signal cannot be seen in the measured spectrum, because its spectral power is much lower than the heart rate signal power.
In conclusion it is notable that this program, based on spectral and correlation analysis method, enables monitoring of cardiovascular system parameters.