
The band gap of indium gallium nitride spans the entire visible spectrum and can be adjusted by changing the indium-to-gallium ratio. Consequently, InGaN structures are attractive for applications in optoelectronics. InGaN is already widely used in commercial blue and white light-emitting diodes as well as laser diodes. These devices are typically manufactured from InGaN/GaN heterostructures. Lattice mismatch between sapphire and GaN buffer layer and between GaN and InGaN layers generates a high density of threading dislocations. Threading dislocations can manifest on the sample surface as V-pits or as three-dimensional loop structures called trench defects, the latter being much less studied.
In this work, the trench defects and their influence on photoluminescence (PL) were studied in InGaN multiple quantum wells (MQWs) with different indium content ranging from 15 % to 35 %. The quantum well structures were grown by metal-organic chemical vapor deposition (MOCVD). The active layer of each sample consists of 5 InGaN quantum wells, 2.8 nm in width, separated by 20 nm thick GaN barriers.
The samples have been studied using confocal and atomic force microscopy. The mapping and study of spatial variation in PL spectra parameters was performed using a confocal microscope installed on the WITec Alpha 300 S microscope system. An objective with numerical aperture NA = 0.9 was ensured in-plane spatial resolution of ~250 nm. The microscope was coupled by optical fiber with a spectrometer followed by a thermoelectrically cooled CCD camera. A CW laser diode, emitting at 405 nm and He-Cd CW laser, emitting at 442 nm, were exploited for excitation. Surface topography was investigated using an atomic force microscope (AFM) installed in the aforementioned microscope system. The spatial resolution of the AFM measurements was ~10 nm. Use of the multi-microscope system enabled spatial matching of the surface topography images with the spatial distributions of PL parameters. All the measurements were performed at room temperature.
The confocal photoluminescence microscopy results show that the spatial distribution of spectrally integrated PL intensity (Fig. 1 A) consists of bright areas on a dark homogenous background. The bright areas are approximately 250 nm in diameter. The analysis of spectral data shows that the photoluminescence spectrum in the dark homogeneous areas is composed of two bands. Meanwhile, the spectra from the bright areas consist of a single band that is blueshifted in comparison to both bands observed in the dark areas (Fig.1 C).
Atomic force microscopy revealed the presence of both pits and trench defects (Fig. 1 B). Further analysis showed that the areas enclosed by a trench loop are at the same level or elevated above the surrounding surface. Not all the observed trench structures feature a complete loop. The densities of both types of defects as well as the surface roughness increase with increasing indium content. In samples with indium content above 30 %, the surface becomes too rough to distinguish separate surface features.
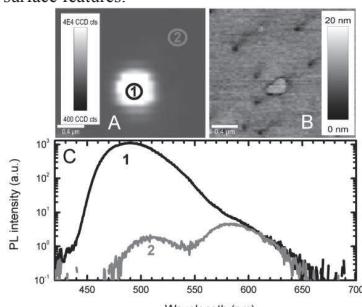
Scanning of same area in both confocal photoluminescence microscopy and atomic force microscopy modes revealed that strong, blueshifted photoluminescence is observed from the areas surrounded by trench defects. The observed structural and photoluminescence features are interpreted by defect diffusion towards trench loops during crystal growth. As a result, a column like volume of structural quality superior to that outside the trench is formed. Stress relaxation, variations in indium content and quantum well thickness in the nanocolumns are also discussed.