
The understanding of the sharp features in the reflectance spectrum obtained employing a sub-wavelength period diffraction grating based refractive index sensor requires numerical analysis of a theoretical model which includes the surface relief and material properties of a grating sensor chip and optical properties of the analyte.
The sub-wavelength (428 nm) period sinusoidal relief sensor chip was fabricated employing holographic lithography and dry etching of a 230 nm thickness SiOx doped diamond like carbon film deposited on fused silica (FS) substrate. The white TM and TE polarized light reflectance measurements (0°, 10°, 20°) were performed employing custom build motorized angular reflectance measurement stand and CCD spectrometer ($\lambda$=360–860 nm) [1]. For normal incidence reflectance measurements a 45° inclined fused silica window was placed in the optical path of an incident beam. The reflectance spectra and electric field distribution for the sensor chip in contact with air and distilled water were simulated employing commercially available “GSolver” and “Comsol" software based on Rigorous Coupled Wave Analysis (RCWA) and Finite Element Method (FEM) respectively. The basic structure of the grating is depicted in the inset of Fig. 1 a. Due to the symmetry of the structure in x and z directions the simulations were done in 2D (the periodic boundary conditions were used). In case of the RCWA method the grating region $d_g$ was divided into 13 layers to approximate the profile to an arbitrary degree of accuracy. The electromagnetic boundary conditions were applied at the interfaces among all regions and the individual grating layers.
Fig. 1 a depicts the experimental and simulated reflectance spectrum of TM polarized light for 10° angle of incidence. It demonstrates characteristic peaks employed for the sensing applications. The existence of the peaks can be understood analyzing the Ez field distribution obtained for the wavelengths corresponding to the peak positions (Fig. 1b, c). These phenomena are called resonance type Wood's anomalies. They are present due to guided modes which may be supported by the waveguide grating (Fig. 1b, c). In our case due to the periodic modulation
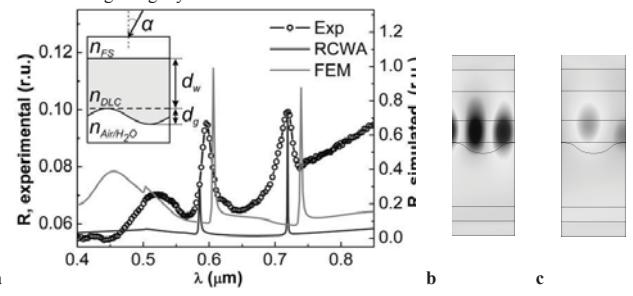
and the asymmetry in the guide supported modes are leaky modes and thus it cannot be maintained on the waveguide grating [2]. The resonance peak is highly dependent on the grating parameters especially the refractive index contrast at the FS/DLC and analyte/DLC interfaces.