Nitride semiconductors have been widely investigated during the last two decades due to their exceptional material properties. The bandgap of the ternary InGaN compound can be varied from 0.7 eV (InN) to 3.4 eV (GaN), thus it is very attractive for the development of light-emitting diodes (LEDs) and laser diodes (LDs) covering entire visible spectral range. Violet, blue and white InGaN-based LEDs are already successfully commercialized, however, the growth of InGaN layers with high indium content is challenging and faces material quality problems.
In this work, the InGaN epitaxial layers with high indium content were studied using photoluminescence spectroscopy. InN and In-rich InGaN thin films were grown by metalorganic chemical vapor deposition (MOCVD) technique on sapphire substrates. All the samples were grown at Vilnius University Institute of Applied Research.
Four samples with different indium content were compared: In0.6Ga0.4N, In0.8Ga0.2N and two InN epilayers with different background electron concentration. Photoluminescence spectra in the near infrared region were measured using a standard spectroscopic setup, consisting of Andor Shamrock 303i spectrometer and iDus InGaAs CCD detector array. CW HeNe laser (${\lambda}$ = 632.8 nm) was used for PL measurements under low excitation conditions, while Q-switched YAG:Nd laser radiation (${\lambda}$ = 1064 nm, pulse duration ${\tau}$ = 10 ns) was used for high excitation conditions. All the measurements were performed at room temperature.
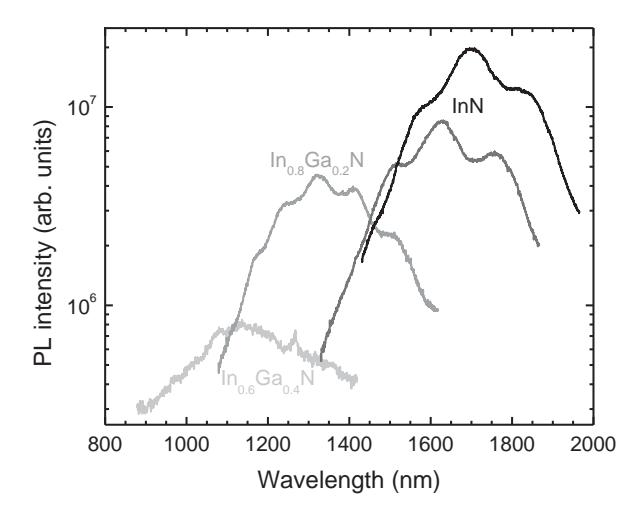
The PL spectra of all four InGaN epilayers measured at low excitations are shown in Fig. 1. As expected, the PL bands shift to the short-wavelength side, as indium content decreases. This is accompanied by the decrease of PL intensity. This decrease is associated with lower quality of the epitaxial layer resulting in increasing rate of nonradiative carrier recombination. The multiple peaks observed in the structure of the spectra are related to Fabry-Perot interference due to PL signal reflection off the substrate. Positions of interference minima and maxima provide a reference for determining thicknesses of each epitaxial layer.
The studies of photoluminescence dynamics at high excitations (up to ~30 MW/cm2) revealed the strong PL band broadening and peak position blueshift with increasing excitation.