
The aim of the study was to determine blood flow dynamics in femoral head after a femoral neck fracture using dynamic magnetic resonance imaging.
42 patients diagnosed with a femoral neck fracture who underwent dynamic magnetic resonance imaging procedure within 24 hours after trauma were included in the study. Relative enhancement ratio was calculated for the affected femoral head.
Before the measurements a catheter inserted into subcutaneous vein in the area of elbow was connected to contrast injection pump that was synchronized with MRI (magnet resonance imaging) machine “Siemens MAGNETOM Symphony" (1.5 T, “Tim System”, Erlangen, Germany). 0.2mg of the contrast material “Magnegita" per 1 kg body mass was injected at rate of 3 ml/s. Scanning procedure started with "T2 trufi ax” and “pd fs cor” modes to identify the locations of femoral heads. Then “fl3D_vibe_MEAS" scanning mode was turned on. Scanning slice thickness was 3 mm. Scanning procedure was repeated at time periods from 0:00 to 6:24 minutes at intervals of 32seconds.
The obtained data was normalized and classified to 3 groups in accordance with AO fracture classification system (31-B1, 31-B2, 31-B3). Each data set was divided into 3 spatial sections of femoral head: the front section (the first third of the head), middle section (the second third of the head), and the rear section (the last third of the head). Then values of the same class patients were averaged. The averages were fitted with model, described with equation 1.
$$I = I_0 + \Delta I \left( 1 - e^{-\frac{t}{\tau}} \right) \tag{1}$$where I is the MRI signal intensity in arbitrary units (a.u.), t – time in minutes, $\tau$ – a signal intensity increase rate in minutes-1, I0 – signal intensity at t = 0, $\Delta$I – difference between I0 and asymptotic maximum intensity Imax.
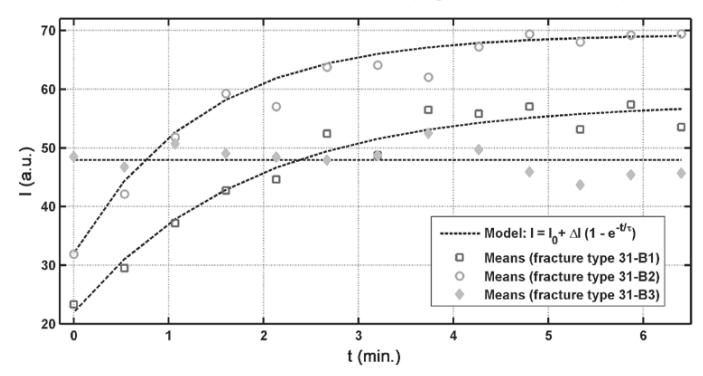
Figure 1 illustrates the results of fitting procedure. The chosen model was fitted well to class "31-B1" and "31-B2" averages' data ($r^2 > 0.95$) while linear dependence $I = I_0$ (i.e. $\Delta I = 0$) was the best fit for class "31-B3".
Our previous study [1] showed that the most significant statistical differences using normalized values of signal intensity were found comparing the data from rear part of femoral head. However, a more detailed analysis is needed to confirm suitability of fitting coefficients ($I_0$, $\Delta I$ and $\tau$) to discriminate between the classes statistically.