
This research focuses on new particle formation (NPF) events on the coast of Baltic Sea at Preila (55°55' N; 21°04' E). The continuous measurements of the particle number size distribution (PNSD) (9-840 nm) were held during the whole year 2013. The NPF events were observed in 111 days of the year, which were classified.
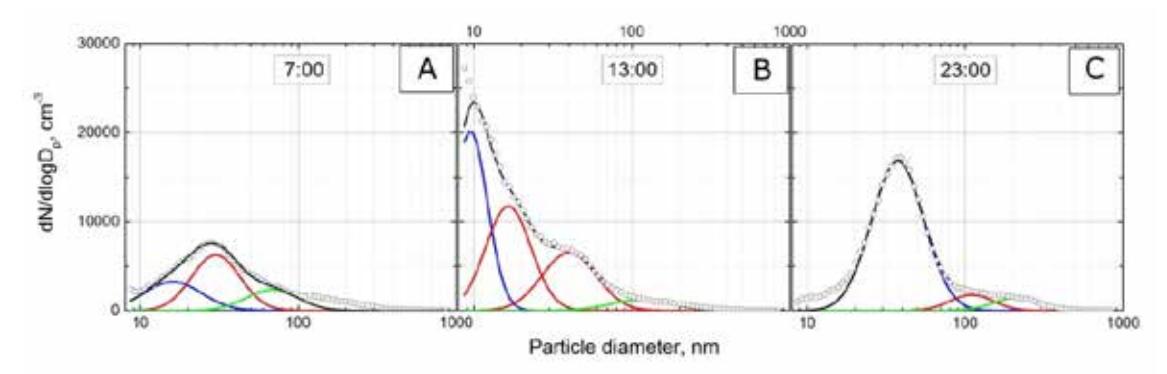
The multi-lognormal fitting (Fig. 1) of PNSD provides useful information about the dynamics of NPF events. The modes were characterised by their PNC values, mean geometric diameter ($D_g$) and geometric standard deviation ($\sigma_g$). It was estimated from the observations that the typical NPF event started at 11:00 and lasted for six hours. During this event the nucleation mode $D_g$ shifted from 7 to 26 nm, with the estimated growth rate (GR) of 3.3 nm·h-1. Though the nucleation and Aitken particle modes are overlapping, different processes are behind the aerosol growth. In Aitken mode aerosol particle GR (6.4 nm·h-1) was c.a. twice as fast as for nucleation mode. It can be explained by lower Kelvin effect to condensational growth of Aitken mode particles and by the additional growth due to the coagulation of ultrafine particles.
The aerosol formation rate ($J_9$), GR and condensation sink (CS) derived at Preila station, were compared in Table 1 with results from other measurement stations in Europe. The $J_9$ of 0.45 cm-3·s-1 at Preila was similar to Utö and Hyytiälä $J_{10}$ values, i.e. 0.45 and 0.70 cm-3·s-1, both stations represent North Baltic Sea region. The CS at Preila was one of the lowest (1.53·10-3 s-1) and similar only to Hyytiälä CS values (2.0·10-3 s-1).
| Location | $J_{10}$, cm-3·s-1 | GR nm·h-1 | CS, s-1 | Reference |
|---|---|---|---|---|
| Preila (coastal, LT) | 0.45 ($J_9$) | 3.8 | 1.53·10-3 | This study |
| Hyytiälä (rural, FI) | 0.70 | 2.9 | 2.0·10-3 | [1] |
| Utö (marine, FI) | 0.45 | 2.3 | 3.8·10-3 | [2] |
| Vavihill (coastal, SE) | 1.54 | 2.5 | 5.4·10-3 | [3] |
| San Pietro Capofiume (rural, IT) | 3.60 | 6.1 | 10.0·10-3 | [4] |
| K-puszta (rural, HU) | 1.20 | 6.1 | 5.0·10-3 | [4] |