
Due to the ever rapidly growing industry of semiconductor materials there is increase in demand for techniques to analyze the quality and properties of the semiconductors. These properties are such as the chemical composition, dopant concentration, level of impurities, sample thickness, etc. [1, 2]. Fourier Transform Infrared Spectroscopy (FT-IR) is a powerful technique in such analysis. It allows to obtain information about properties of the material in a non-destructive way, although it does have its limitations. One of the problems occurring in the measurements of thin samples is the appearance of interference (fringes). To be more precise, the occurrence of these fringes is determined by the value of 2nd, here n is the real part of the refractive index of the sample, d is the thickness of the sample [1]. Since the interference is caused by multiple reflections inside the sample it is possible to derive the dependence of the interference pattern by using Fresnel's relations Eq. (1). The equation is obtained with the hypothesis that the coherence length of the incident electromagnetic wave is infinite. This in fact is not true.
$$T = \frac{(tt')^2 e^{-\alpha d}}{1 + r'^4 e^{-2\alpha d} - 2e^{-\alpha d} r'^2 \cos(\frac{2\pi}{\lambda} 2nd)}\tag{1}$$Here $t = \frac{2}{1+n}$; $t' = \frac{2n}{1+n}$; $r = \frac{1-n}{1+n}$; $r' = \frac{n-1}{1+n}$, $\lambda$ is the wavelength of the incident electromagnetic wave and $\alpha$ is the absorption coefficient at a given wavelength. This interference pattern appearing in the spectra makes it difficult to evaluate exact peak positions and heights, thus also the integrated intensity.
There are several ways of dealing with the interference pattern. One of them makes use of Brewster's angle [3], in order to avoid reflections. The second method is to generate a function that mimics the interference pattern Eq. (1), while the last one is based on removing the echo peaks from the interferogram [3]. The result of such manipulation can be seen in Fig. 1.
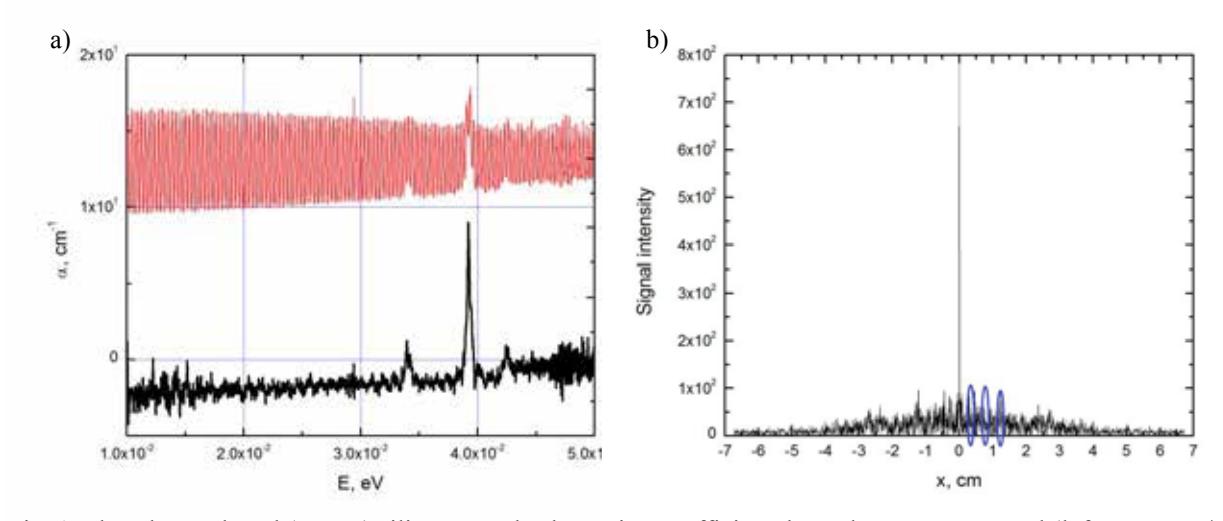
As seen in the Fig. 1 by manipulating the interferogram it is possible to obtain good results in the reduction of the interference pattern within samples with low values of 2nd. More thorough studies need to be performed to obtain information on the reliability and limitations of this method.