
Drought is the natural phenomenon and primarily associated with the loss or reduction of agricultural production, forestry and water resources. An analysis of droughts and their impacts assessment can help to choose the measures for drought impact mitigation in vulnerable regions. One of the major problem is the drought diagnostics [1].
Droughts can be diagnosed using different indices like SPI (standardized precipitation index), PHDI (Palmer hydrological drought index) and HTC (Selianinov hydrothermal coefficient) [2]. These indices require special or conventional observations: meteorological, agricultural etc. Data from meteorological stations not always are representative local scale precipitation patterns as well as for specific soil or vegetation areas.
The drought diagnostics uses the remote sensing method. Only satellites sensors that have a high spatial resolution (0.01°) are under consideration. Sensors register the amount of short wave radiation reflected and long wave radiation emitted from the surface objects [3].
In this study Normalized Difference Vegetation Index (NDVI) was used (1). It shows the surface vegetation "greenness”. Briefly speaking it measures plant reflection of red (R – wavelengths 0.58–0.68 μm) and near-infrared (NIR - wavelengths 0.73–1.10 μm) radiation. Data series covers the period from 1981 to present. NDVI values vary from 0.1 (no vegetation) to 1.0 (perfect greenness).
$$NDVI = \frac{NIR - R}{NIR + R}\tag{1}$$NDVI was detected by AVHRR and MODIS sensors on board of NOAA, Terra and Aqua series satellites in 1981-2015 year. Areas for analysis were selected according to the different moistening conditions in Lithuania (Fig. 1) [2]. Information about air temperature, precipitation, snow depth, snow cover and ground frost length was included to the analysis to determine relationship between NDVI values and meteorological conditions.
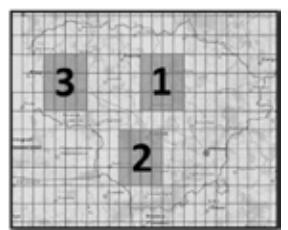
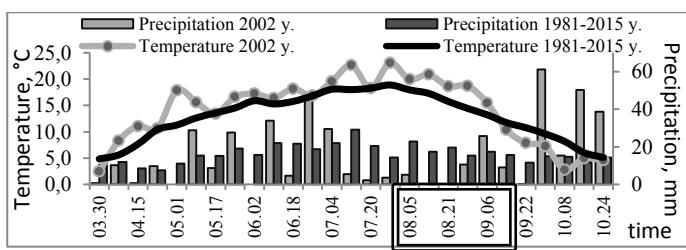
The negative anomalies (drought conditions; standardized NDVI value below -2) were determined 1.8 times more often than the positive. According to NDVI the vegetation period droughts are most common in the third area (Fig. 1). It was also found that NDVI is able to identify all dry periods as of using HTC [2]. Drought development in 2002 within area 2 is shown in Fig. 2 and Fig 3. Rectangular shows drought period identified by HTC. During this drought (08.03–09.14) the mean air temperature was 2.8 °C higher than 1981–2015 climatology while precipitation amount was less by 44 %. Standardized NDVI values varied from -1.7 till -2.6.
NDVI capable to diagnose more drought periods during the same time comparing to other indices. Droughts are often localized in small areas due to spatial unevenness of precipitation regime. However, the negative NDVI anomaly not always means a drought conditions. In spring the low NDVI values can be related with prolonged winter season and as a consequence a later than usual start of vegetation. Also late frosts in spring and early frosts in autumn have negative impact on vegetation conditions. The results of this study show that the drought index based on remote sensing method could be the alternative instrument in drought analysis and monitoring.