
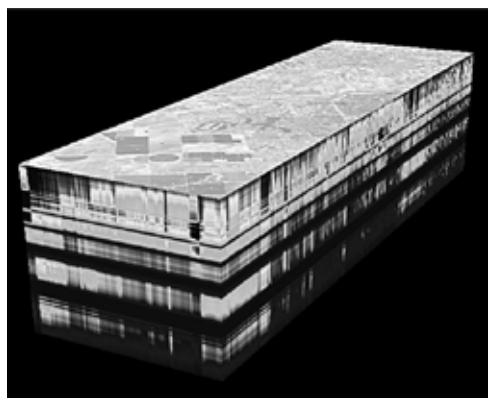
Spectroscopy is widely used in remote sensing for obtaining complete information about the Earth's surface. Hyper Spectroscopy with high spatial resolution results in obtaining spectral characteristics of all surface points under study allows investigating the state of the objects. The obtaining three-dimensional array of points is called "Spectral hypercube" and shows dependence of the recorded radiation on two spatial coordinates and wavelength.
The software complex (SC) under development is intended for processing hyperspectral images obtained by air-borne or space-borne shooting. SC is connected to specific remote sensing equipment (Fourier transform hyperspectrometer), takes all features of it into account and therefore provides alternative to universal commercial software packages.
The development of program modules is performed in C++ with QT framework. Structure of SC represents a set of plugins that can be divided into two groups: data reading modules and mathematical computations and transformations modules.
The modules implemented at the moment:
- loading of AVIRIS hyperspectral data [1];
- graphic representation of hypercube in the form of 3D object (Fig. 1.) with tools for manipulating of hypercube visualization. 3D module is intended for preliminary data analysis;
- data representation as a set of separate channels. 2D module is intended for more convenient work with the separate channels of the hypercube and provides advanced functionality;
- selection of regions of interest for further processing and calculating of different statistics;
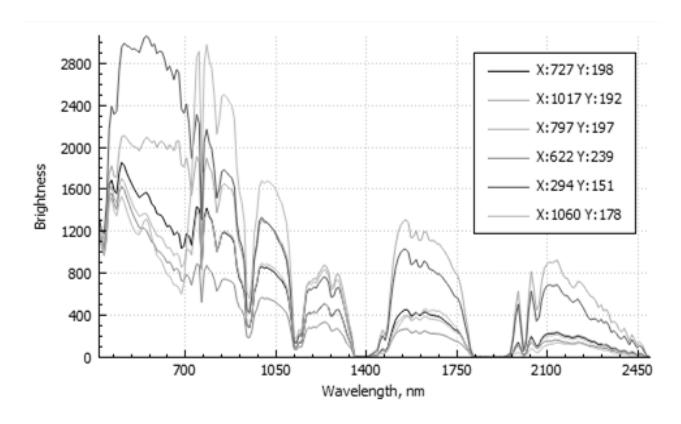
- graphic representation of the spectral curves (Fig. 1.) for any selected spatial pixels at the hypercube;
- graphic representation of spatial profiles along any line at the image for each spectral channel;
- synthesis and displaying of color(R, G, B) and pseudocolor images including image formation with a predetermined spectral profile;
- noise reduction in images as well as in spectral profiles;
- contrasting images in spectral and spatial domains;
- histogramming [2];
- comparison between spectral curves and calculating of the degree of their proximity. Searching pixels having close spectrograms with defined confidence interval and allocation them at the image;
- formation and operation with the set of spectral libraries [3].
These plugins are independent and can be run from other modules with corresponding initial preferences.
SC under development can be effectively used in scientific researches as well as for solving applied problems. Further investigations will be performed in order to create atmospheric correction techniques and object classification.