
Cancer is one of the most common causes of death in the world [1]. In some cases tumor can be treated by removing it while functional tissue around it is stored. The determination of the exact margin between normal and cancerous tissues during a surgery is one of the most important factors for a successful treatment, favorable prognosis and reduced risk of recurrences of cancer.
During the last decade, various methods of infrared spectroscopy were applied for the tissue analysis of different types of human cancer. The methods showed good results for the identification of the removed cancerous tissues [2-4]. During the process of cancer development, the changes of chemical content of the cells are observed in the biological tissue. These changes on the molecular level can be determined by analyzing the infrared spectra of the tissue. In this work, the technique of an attenuated total reflection of infrared radiation (ATR IR) is applied for the analysis of the extracellular fluid (ECF) of the normal and tumorous human kidney tissue containing single cells. This technique allows examining the ECF of the tissue immediately after the surgery directly in OR since this method does not require any special preparation of the specimen. When this technique is applied for the tissue recognition in vivo, there is the need of special software for determination of cancerous tissues.
In this study, there were analyzed the ATR IR absorption spectra of ECF of the normal and tumorous human kidney tissue of 115 patients undergoing partial or radical nefrectomy.
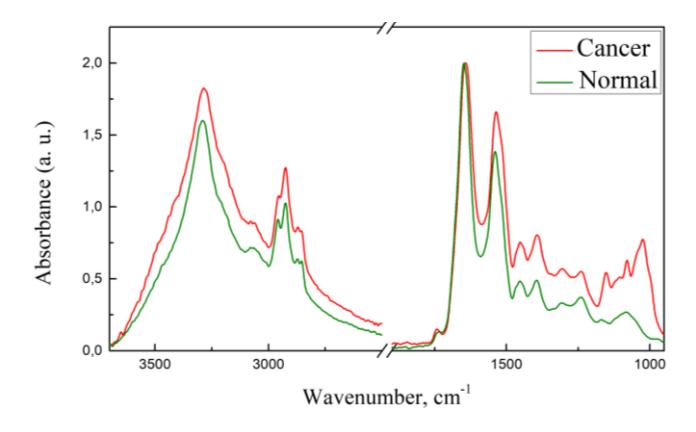
The main differences between ATR IR absorption spectra of ECF of the normal and cancerous human kidney tissue are observed in the spectral region $1200-950\text{ cm}^{-1}$ where spectral bands of the $\upsilon$ (C-O), $\upsilon$ (C-C) and $\delta$ (C-O-H) vibrations of glycogen are located (Figure 1). In this region, there are observed two spectral bands in the case of normal and three bands in the case of cancerous kidney tissue.
In this work, there was created an algorithm and written a computer program for automatically identification of normal and cancerous human kidney tissues by analyzing the ATR IR absorption spectra. The program compares the spectrum that is being analyzed with the spectra from the spectral library, which is built from previous studies. The library contains the ATR IR absorption spectra of ECF of the normal and cancerous human kidney tissue, water and ethanol. The program is capable to recognize the tissue type immediately after registration of the spectrum. Due to the fact that the most frequently diagnosed type of human kidney malignant tumor is a clear cell renal cell carcinoma (86 %), the best results are achieved for the identification of cancerous tissue of this type of the tumor. The program identifies the cancerous tissue with 90 % accuracy, while the normal tissue is identified with 94 % accuracy. After evaluation of the validity of this method for the cancerous tissue diagnosis, it was established that the tissue type can be identified with 90 % sensitivity and 94 % specificity, while the positive and negative predictive values reached 93 % and 92 % respectively. It is possible that the normal human kidney tissue could be recognized with better accuracy according to the probable differences between ATR IR absorption spectra of ECF of the different kidney tissue areas.