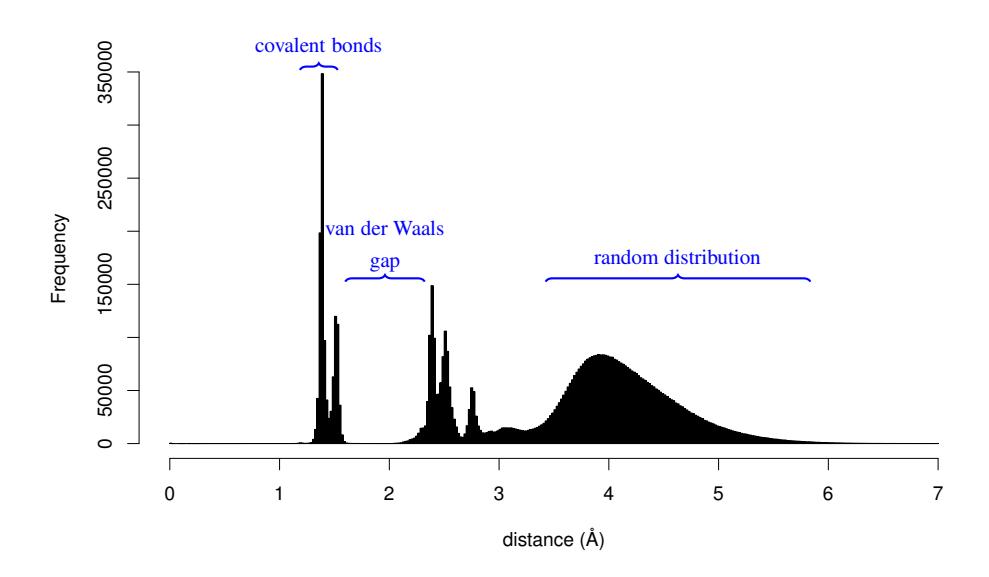
Methods of crystal structure determination, most prominent of them being X-ray crystallography, provide exact 3D coordinates of the atoms that constitute crystal structures. Chemical bonding, which is usually of interest to the chemists, is not captured by crystal structure determination methods and has to be inferred from the coordinates of the atoms. Usually, two atoms are assumed to be connected by a chemical bond if the distance between them is shorter than the sum of their element-specific bonding radii, typically covalent radii, that is an usual radius of an atom in a covalent bond. This method has been known at least since the publications of William Lawrence Bragg [1]. However, there is no one univocal table of covalent radii as the methodologies for defining and deriving them differ strongly. It has been noted that clear distinctions exist in the distance distributions of atom pairs, allowing to differentiate between bonded and non-bonded interactions. Unpopulated ranges correspond to the so-called van der Waals gap, a region of energetically unfavourable interatomic distances, which may in some cases be contaminated due to the presence of non-covalent interactions. Furthermore, distance distributions of some elements, such as alkaline elements, copper, silver, mercury, iron, tin to name a few, do not have such a clear van der Waals gap and pose a difficulty in fitting them to the aforementioned approach [2]. Nevertheless, distance criterion for connectivity is widely used, and covalent radii for problematic elements have been approximated.
We have made an attempt to investigate the bonding radii of atoms using a statistical approach. Distances between nearest neighbouring atoms, as established by 3D Voronoi tessellation of the crystal [3], were measured in each of the 380000 crystal structures in the Crystallography Open Database (COD, http://www.crystallography.net) [4] and pooled together for analysis. Limiting observations to those of the neighbouring cells of Voronoi tessellation allowed to curb the most of the non-informative random distribution of long distances without the need of artificial cut-offs. Visual analysis of the resulting histograms reveal clearly separated high density regions corresponding to the covalent and van der Waals interactions as well as other features with chemical meaning. To identify these features, automatic unsupervised statistical methods [5] could be harnessed.