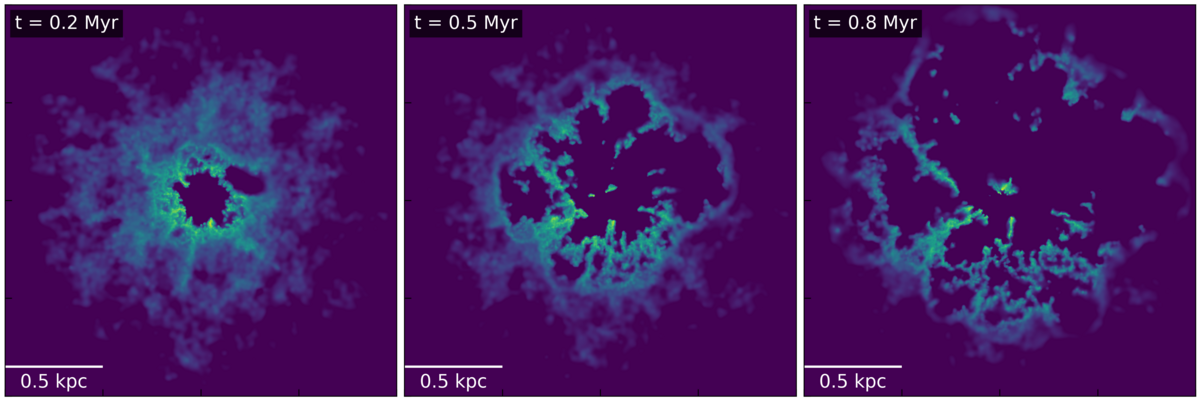
Supermassive black holes (SMBHs) at galactic centers significantly influence their environment through gravitational forces and energetic feedback mechanisms. Active galactic nuclei (AGN) outflows interact with surrounding gas structures, affecting galaxy evolution. Understanding these interactions is crucial for modeling large-scale astrophysical processes. This study aims to determine how AGN with different luminosities influence the evolution of inhomogeneous gas clouds, with a focus on mass outflow rates, momentum transfer, and energy transport.
We conducted smoothed particle hydrodynamics (SPH) simulations using the GADGET-3 code, incorporating SPHS modifications [1] for enhanced resolution. The models included different AGN luminosities and initial turbulence conditions to assess their impact on outflow characteristics. Higher AGN luminosities accelerate gas ejection and increase fragmentation of gas clouds. Enhanced mass transport and kinetic energy transfer were observed at elevated luminosities, aligning with theoretical expectations [2]. However, cooling of the outflowing gas reduced outflow efficiency, leading to deviations from analytical predictions.
The findings highlight the importance of cooling effects in AGN-driven outflows, suggesting that theoretical models must incorporate these mechanisms for accurate predictions. Moreover, our results indicate that AGN luminosity plays a crucial role in shaping outflow dynamics, with higher luminosities leading to accelerated gas ejection and increased fragmentation. Future studies should explore additional environmental factors, including the impact of AGN luminosity variations.