
Laser-Induced Breakdown Spectroscopy (LIBS) has become a method for rapid, contact-free elemental analysis of various kinds of surfaces and bulk materials. In combination with a laser's ability to perform controlled, step-by-step ablation, stratigraphic analysis is a logical option as well. In order to gain the highest possible amount of information from such an experiment, detailed knowledge of the ablation process, as well as a reliable way of tracing the spectral emissions, is necessary.
In the experiments presented here, a sample consisting of a galvanic coating of aluminium on steel, separated by a thin nickel layer, was analysed using both the second (532 nm) and fourth (266 nm) harmonic of a Nd:YAG laser for ablation and plasma generation. SEM imaging and EDX line scans were used to gain independent information about the layer formation.
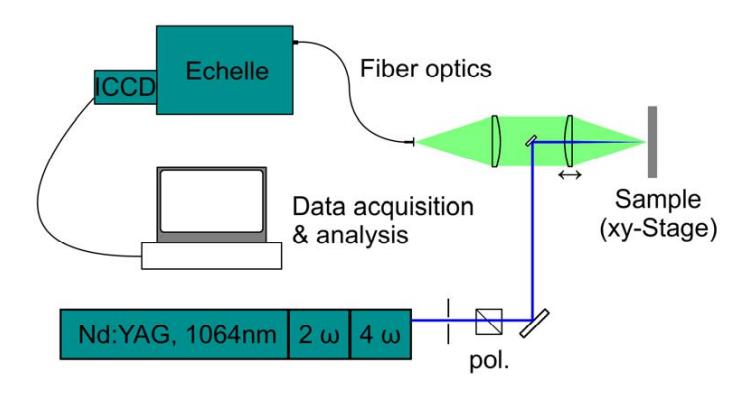
Rather than tracing individual emission lines, the LIBS signal was generated by calculating the linear correlation coefficient, r between each recorded spectrum and previously recorded high-resolution standard spectra of the expected elements. This method has the advantage of compensating for influences by fluctuations in laser fluence, as well as effects such as self-absorption in the generated plasma [1]. The empirical fitting functions used to describe the signal give an excellent description of the analytical results [2]. Comparison of the signal onset for Ni and Fe with the position of the layer interfaces determined via EDX traces allows calculation of the ablation rate h.