
Aerosol emissions from biomass and fossil fuel burning have a huge impact on air quality and climate. These processes together with atmospheric oxidation of biogenic and anthropogenic volatile organic compounds are the main sources for carbonaceous aerosol particles [1].
The knowledge of long-range transport origin and contribution to pollution level can help outspread the understanding of the nature of local air pollution at a given location. Long-range air mass backward trajectories are evaluated using HYSPLIT4 model [2]. For estimating potential pollution source areas, different receptor modelling approaches, i.e. air mass cluster analysis and concentration weighted trajectory (CWT) analysis, were applied [3].
Measurements were conducted at the Atmospheric Research Station located in Preila (55°55′N; 21°04′E) from 1st to 31st of March 2014. Two instruments were used during the measurement campaign. Aerosol Chemical Speciation Monitor (ACSM) provided continuous measurement of aerosol chemical components: organics, SO2-4, Cl-, NH+4 and NO3 [4]. The Aethalometer (Magee Scientific model AE31) was deployed to measure carbonaceous aerosol particle light-absorption properties and black carbon (BC) concentration.
| Clusters | Org., | SO2-4, | NO3, | NH+4, | Cl-, | BC, |
|---|---|---|---|---|---|---|
| μg m-3 | μg m-3 | μg m-3 | μg m-3 | μg m-3 | μg m-3 | |
| 1 | 8.94 | 2.25 | 0.56 | 1.68 | 0.23 | 1.29 |
| 2 | 5.64 | 0.91 | 1.10 | 1.34 | 0.18 | 0.51 |
| 3 | 3.30 | 1.20 | 3.23 | 1.03 | 0.21 | 0.50 |
| 4 | 6.81 | 2.21 | 1.42 | 1.28 | 0.06 | 0.25 |
| 5 | 1.60 | 0.71 | 1.26 | 0.30 | 0.08 | 0.80 |
| 6 | 4.62 | 1.12 | 1.54 | 1.35 | 0.23 | 0.60 |
| Mean | 4.25 | 1.56 | 1.71 | 1.21 | 0.12 | 0.82 |
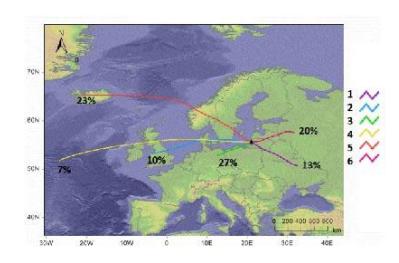
Clustering of air masses is representation of similar trajectories by movement and direction. The air masses from W and NW direction, represented in clusters 2, 4 and 5 (Fig. 1), were longer and moved faster, while trajectories in clusters 1, 3 and 6 were shorter and moved slower.
The 1st cluster represented the SE air mass trajectory pathway with the highest mean concentrations for the whole measurement period (Table 1). In this cluster, the influence of biomass burning in Belarus and Ukraine was indicated due to high CWT values. The trajectories of the 3rd cluster were the shortest, therefore air masses spent more time over the small area (i.e. Kaliningrad and Poland). It could be indicated that the accumulation of pollutants from the grass fires, which had occurred at that time of the year. In this cluster, the highest BC concentration reached up to 12.00 μg m-3 and average total loading of ACSM was 7.20 μg m-3, organics contributed to more than half of the aerosol mass. The 4th and 5th clusters were represented by clean and fast moving air masses from the W and NW and resulted in BC concentrations equal or lower than estimated mean value of 0.75 μg m-3 in Preila.