Star clusters are key for studying galaxy formation and evolution. Photometry of a large sample of star clusters in the Andromeda (M31) galaxy by the Hubble Space Telescope (HST) would enable studying star formation processes across the galaxy disk in detail. Observations were performed in the framework of the Panchromatic Andromeda Treasury (PHAT; [1]) survey, which covered a third of the M31 disk, and results for a large number of star clusters are already published [2][3]. These clusters reside in diverse environments, from dense central parts of the galaxy to the sparse outskirts.
The aim of our study is to perform a new multicolour high-accuracy aperture photometry of star clusters by carefully accounting for bright field stars projecting on clusters and to derive cluster parameters. We use a two-aperture method described in [4]: (i) standard aperture photometry to measure 'total' (T) magnitudes; (ii) adaptive aperture photometry to measure 'colour' (C) magnitudes of clusters' central parts. We select C apertures to avoid bright field stars, thus ensuring more consistent star cluster colours.
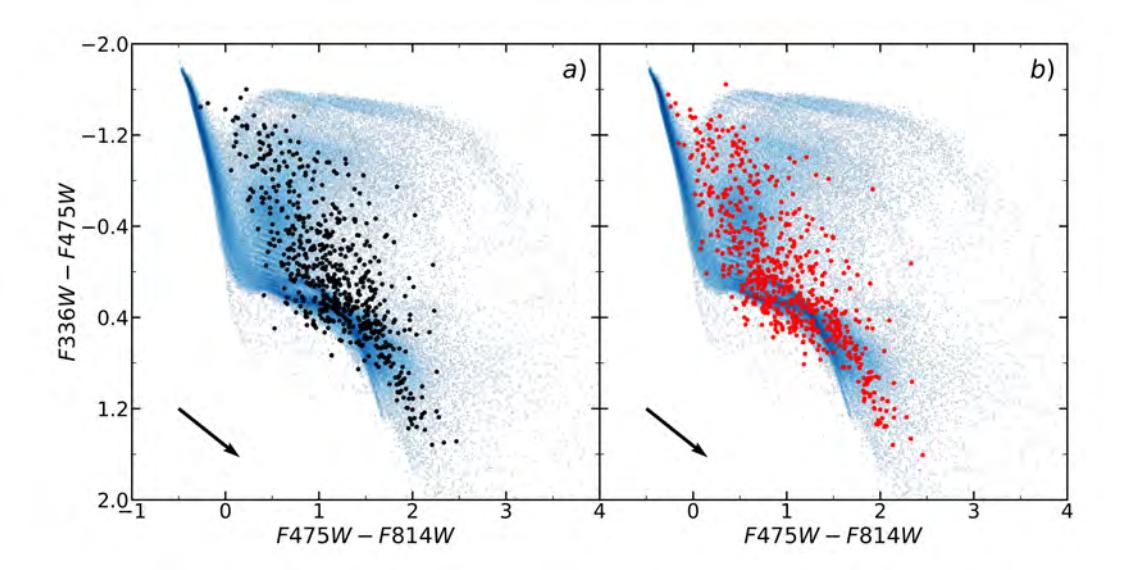
In Fig. 1(a,b) we show two-colour diagrams of 646 star clusters (selected by applying a requirement of photometric accuracy in all three passbands, $\sigma_{F336T,F475T,F814T} < 0.03$) constructed from T (a) and C (b) magnitudes. The main differences arise due to the smaller number of the non-cluster stars residing within apertures used for photometry. Fig. 1b shows more compatible colours of the real clusters and stochastic star cluster models, especially in the sense of artificial excess extinction arising due to red field stars. Thus, Fig. 1 clearly demonstrates validity and quality of the new aperture photometry method.