Star formation mostly happens in clustered environments, such as star clusters and stellar associations. This makes star clusters an important tool for understanding the formation and evolution of their host galaxies. Cluster parameters are derived using various methods that often employ broad-band photometry results. However, earlier studies have shown that in the cases of young (<1 Gyr) low mass (<104 M☉) star clusters, such methods are susceptible to uncertainties introduced by the stochastic nature of bright star distribution inside clusters [1,2].
The aim of this study is to evaluate the effects of bright star distribution and random cluster projection in the plane of the sky on the accuracy of star cluster parameters. We simulated a grid of artificial 3D clusters covering the parameter space of real objects observed in the Andromeda galaxy (M31). Distributions of stellar masses were modelled using the Kroupa initial mass function [3], and spatial distributions of stars were generated according to Elson-Fall-Freeman profile [4]:
$$\rho(R) = \rho_0 (1 + R^2/r_0^2)^{-(\gamma+1)/2},\tag{1}$$where $\rho_0$ – central cluster density; R – deprojected (3D) distance from the cluster's center; $\gamma$ – power-law slope of the cluster's radial profile; $r_0$ – scale factor, related to the cluster's core radius, $r_c$, through $r_c = r_0 (2^{2/\gamma} - 1)^{1/2}$. The explored parameter ranges of solar metallicity models are: mass – from 102 to 104 M☉; age – from 10 Myr to 10 Gyr; $r_c$ – from 0.05 to 0.80 arcsec; $\gamma$ - from 2.2 to 7.0. At each node of the grid, we simulated 100 different clusters and generated their images to be consistent with real observations of M31 clusters in the PHAT survey [5]. Images were produced using 100 different 2D projections of each model, imitating their observation from 100 different angles. Simulated frames were measured by applying aperture photometry techniques [6].
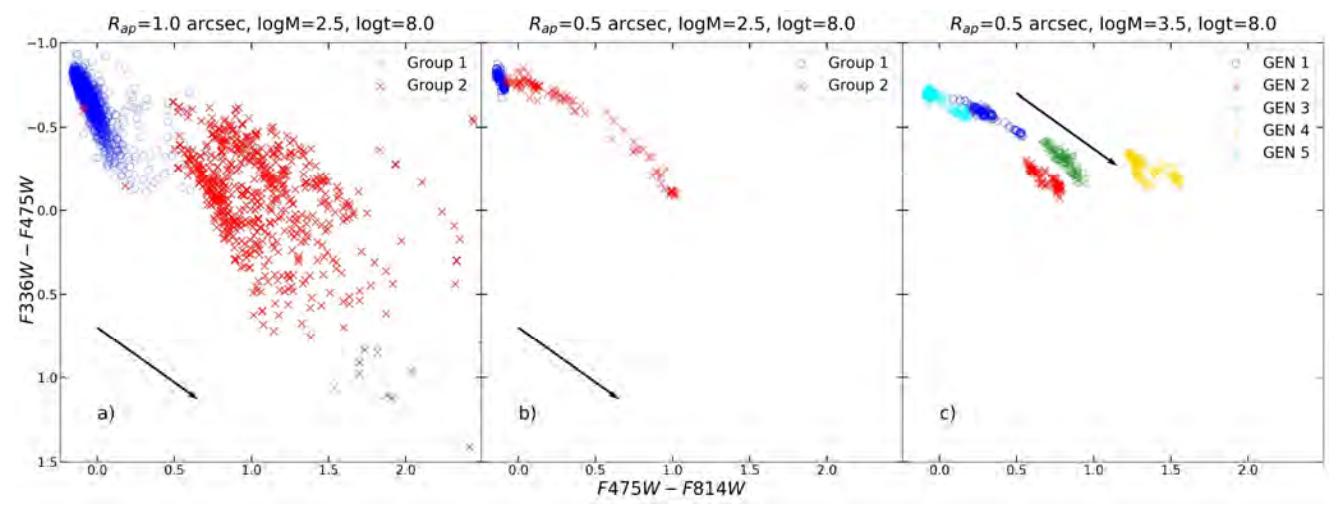
We have demonstrated that young low-mass clusters without (Group 1) and with (Group 2) post-main-sequence stars photometrically differ significantly (Fig. 1). Clusters of Group 1 occupy a much smaller area in the colour-colour diagram (CCD) compared to the Group 2 objects, which are redder and their colour indices (CIs) cover a broader range (Fig. 1a). In Fig. 1b the corresponding ranges of CIs arising solely due to different viewing angles are much smaller. However, they are larger than photometry errors; thus, they must be considered. We also find that the spread directions of clusters' CIs closely follow the direction of the extinction vector, suggesting that projection effects imitate those of extinction (Fig. 1c).