According to the World Health Organization, air pollution is associated with ~7 million premature deaths worldwide annually [1]. The main sources of aerosol particle pollution in the cities are of anthropogenic origin [2], where today about 56% of the world's population lives (in Lithuania - 68%) [3]. In this way, urban air pollution is the biggest global environmental quality challenge in the context of health. Aerosol particles are a major component of urban air pollution and include a mixture of aerosol particles ranging in size from a few nanometers to tens of μm.
This study uses a Scanning Mobility Particle Sizer (SMPS, TSI 3936) and Aerodynamic Particle Sizer (APS, TSI 3321) for simultaneous measurement of particle number concentration (PNC) and size distribution in the summertime in urban environment (Vilnius). In this study, particles were classified into three modes based on particle diameter: nucleation mode (10-25 nm), Aitken mode (25–100 nm) and accumulation mode (100-1000 nm). The analyzed period was divided into three episodes based on measured aerosol particles mass concentration and prevailing wind direction: Episode 1 (June 1st – June 11th), Episode 2 (June 12th – June 23rd 11:00) and Episode 3 (June 25th – June 30th). The night of June 23-24th was classified as a special event due to wood burning in open bonfires in relation to St. John's Day (Midsummer) which is a national celebration in Lithuania and Latvia.
Monthly average total aerosol mass concentration for particles in the 10-16000 nm size range varied from 1.6 to 43.9 μg/m3 (with maximum on June 23th 23:55). During Episodes 1, 2, and 3, the mean aerosol mass concentration was 14.7, 8.9, and 14.8 μg/m3, respectively. In contrast, the mean monthly PNC in the same size range was 4.6 × 10³ #/cm3 (SD = 3.1 × 10³), with an instantaneous maximum of 29.5 × 10³ #/cm3 (on June 7th 14:25). On Midsummer day, the average values of aerosol mass concentration and PNC were 16 μg/m3 and 7.6 × 10³ #/cm3, respectively. Meanwhile, the maximum PNC value (27 × 103 #/cm3) on June 23th 23:55, indicated an extremely polluted midnight. In consequence of common tradition – bonfire night, on Midsummer it was caused mean mass and PNC increase by over 50% compared to the average mass and number concentration levels of the whole month of June.
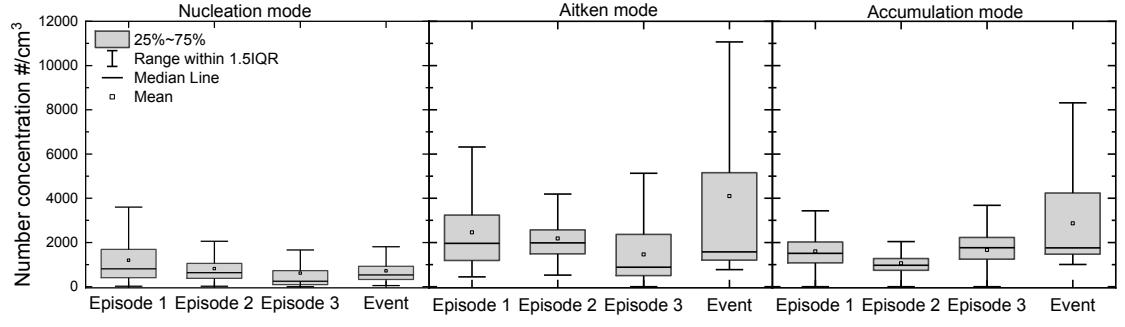
The particles in Aitken mode had the largest input to the total PNC (Fig. 1). During Midsummer event a two-fold increase was observed in the mean Aitken mode particle number concentration compared to all episode concentration (Event - 4.1 × 10³ #/cm3 and 1-3 episode 2.4, 2.2, 1.5 × 10³ #/cm3, respectively). Our results reveal a significant contribution of open biomass burning to Aitken mode which can growth to larger sizes. Particles in nucleation mode were mainly derived from new particle formation [4], while Aitken mode particles were mainly influenced by biomass, biofuel combustion, anthropogenic emissions [5] and the growth of nucleation mode particles.
Increasing PNC of ultrafine particles due to biomass burning poses a great risk to human health, since there are no guidelines for ultrafine particles number concentrations.