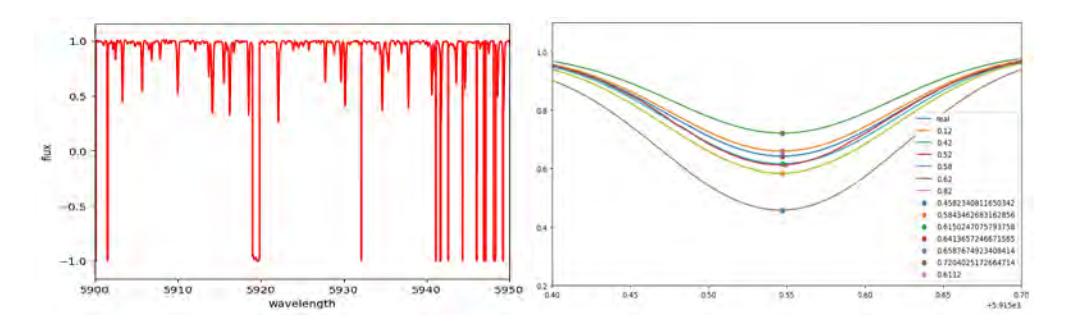
Atmospheric parameters of stars are among the most important data received from a star. Processing the spectrum and knowing the class of the star allows you to find out such information as the temperature of the photosphere (Teff), the acceleration of free fall on the surface (log(g)), the metallicity ([Fe/H]) and the turbulent velocity (Vt). Thus, it becomes possible to obtain basic information about the state of the star and assume its further evolution [1-4].
After the spectrum is obtained it is possible to process regions of the spectrum of a star at specific wavelengths that correspond to the lengths of the absorption bands of any element, it can be oxygen, nitrogen, or the most important element for studying, iron. To do this, the Python programming language software, as well as the Splat-VO program, were used.
By means of data selection, it is also possible to generate a synthetic spectrum using Moog and/or Turbospectrum softwares, if the entered data is correct, the resulting spectrum will coincide with the spectrum from the stars obtained by the observations and by using fitting algorithm. After the processing of the required number of wavelengths and the graph of the growth curve is satisfactory, the work is completed by overlaying the data in a spectrum and comparing it with the original one.
Using synthetic spectra is one way to analyze stellar spectra. Generating the spectra is slow, so trying out all possible combinations of the input parameters can take a very long time. The main advantage of this method is that it can also measure the abundances of molecules in stellar atmospheres, for example, CN and TiO. This is not possible with other methods and is why we use synthetic spectra.