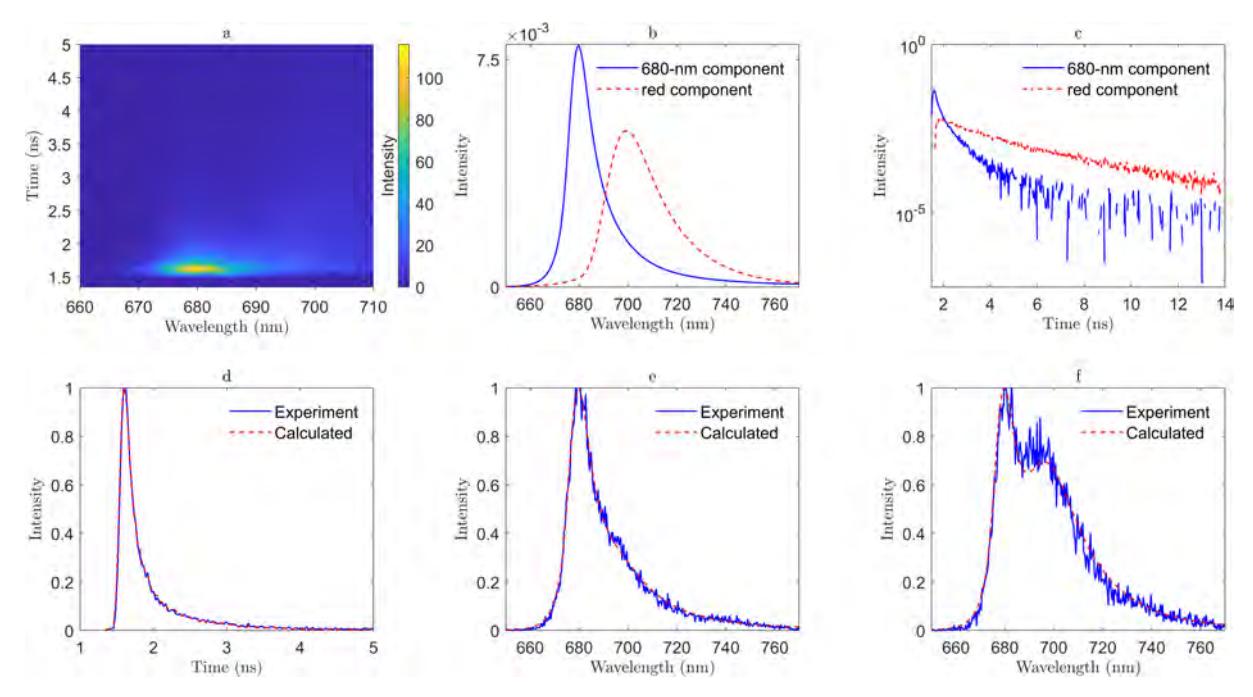
Fluorescence is a widely used method in various fields of science to easily analyze electronic excitation dynamics in molecular systems. Global and target analysis are used in order to extract meaningful data from time-resolved fluoresence spectra. The more complex the molecular system is, the more difficult it is to do so, hence the search for new and effective data analysis methods is still relevant to this day [1, 2]. In our study we use species associated kinetics method. Firstly we described the intensity of fluorescence as its' spectra and decay kinetics and postulated the shape of the spectra by Gaussian and pseudo-Voigt functions. Solving the optimization problem allowed us to obtain the spectra and then we used The Moore-Penrose pseudo inverse method [3] and calculated both decay kinetics and the intensity of fluorescence. This method was applied to the data of light harvesting complexes II – (LHCII) trimers and their aggregates, previously analyzed in Nature Plants article [4]. By introducing a more complex pseudo-Voigt function, we hoped to account for the assymmetry of fluorescence spectra in a straigthforward way and get accurate results more easily.
Fig. 1. Time-resolved fluorescence measurements of LHCII aggregates at 100 K temperature using species associated kinetics with pseudo-Voigt function. a, Two-dimensional plot illustrating evolution of fluorescence intensity. b, Normalized fluorescence spectra. c, Normalized fluorescence decay kinetics. d, Vertical slice of experimental and calculated fluorescence intensities with $\lambda$ = 679 - 682 nm wavelength interval. e, f, Horizontal slices of experimental and calculated fluorescence intensities with t = 1.6 – 1.9 ns and t = 1.9 -2.1 ns time intervals respectively.
[1] J. R. Lakowicz, Principles of fluorescence spectroscopy, 2006.
[2] C. Slavov, H. Hartmann, and J. Wachtveitl, Implementation and evaluation of data analysis strategies for time-resolved optical spectroscopy, Analytical Chemistry, 2015, 87, 2328–2336.
[3] E. K. Chong and S. H. Zak, An introduction to optimization, 2013.
[4] J. Chmeliov, A. Gelzinis, E. Songaila, R. Augulis, C. D. Duffy, A. V. Ruban, and L. Valkunas, The nature of self-regulation in photosynthetic light-harvesting antenna, Nature Plants, 2016, 2, 16045.