
Carbon ($\delta^{13}$C) and nitrogen ($\delta^{15}$N) stable isotope ratios in human tissues are related to individual dietary habits as well as environmental and physiological factors. Typically, carbon provides information on the primary energy source, while nitrogen allows discrimination among trophic levels [1]. Due to easy and non-invasive sampling, hair is a good tissue for modern human analyses. In forensic science, stable isotope ratios of human remains such as hair are mainly used for geographical allocation [2]. Therefore, knowledge of the impact of various factors on stable isotope distribution in human tissues is an important component in the interpretation of the analytical results of stable isotopes.
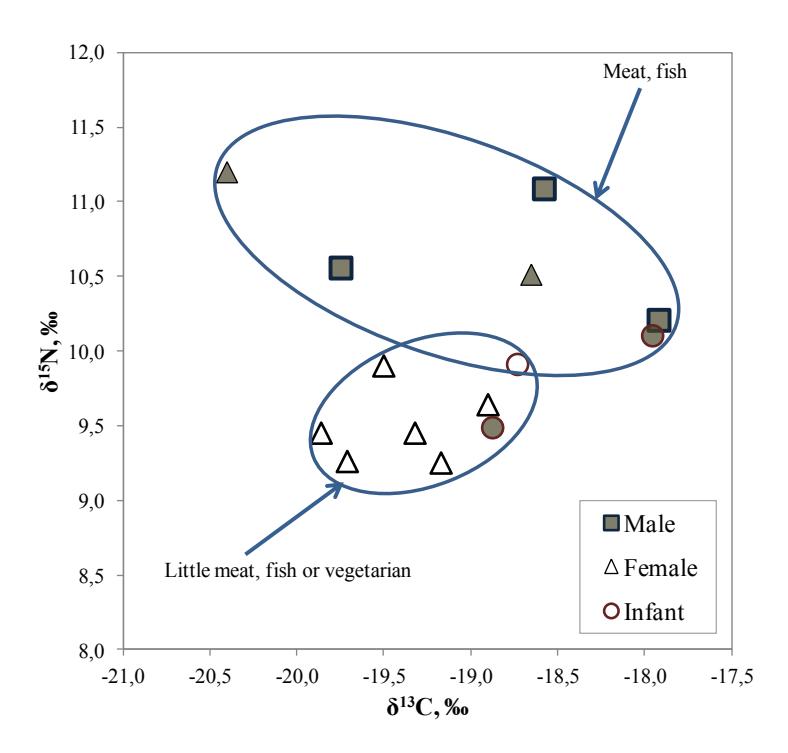
In this study, modern human hair samples were analyzed to show the dietary differences according to their dietary practice and the main food source (plant, meat, or fish). People who reported a low-meat or vegetarian diet $\delta^{13}$C values range from -19.9 to -18.7 ‰, the average is -19.3±0.4 ‰, while $\delta^{15}$N values range from 9.3 to 9.9 ‰ and do not exceed 10 ‰, the average is 9.6±0.2‰. Meanwhile, people whose diet is dominated by meat and fish products, average $\delta^{13}$C is higher -18.9±0.9%, ranging from -20.4 to -17.9 %. The average $\delta^{15}$N value is also higher 10.5±0.6‰, ranging from 9.5 to 11.2‰.
According to $\delta^{15}$N, those who eat more meat and fish have higher nitrogen stable isotope values to compare with vegetarians or those who eat meat occasionally, these groups differed statistically significantly (Kruskal-Wallis test p < 0.05) (Fig. 1). A modern human hair isotopic study reveals that $\delta^{15}$N values of those who eat fish and meat has $\delta^{15}$N values > 10 ‰. A further study on modern human hair samples showed changes in retrospective life history according to segmental hair measurements.
In addition, the present stable isotope data set in Lithuania could be enlarged including samples of different contexts that may help in the interpretation of carbon and nitrogen stable isotope results of modern or ancient humans in view of dietary preferences, region, or health issues.