Infectious diseases of the central nervous system (CNS) are associated with significant morbidity and mortality. Early and precise distinction is essential to ensure appropriate therapy. However, infection cannot be clearly determined using clinical symptoms, physical examination, or routine laboratory studies alone [1]. Cerebrospinal fluid (CSF), due to its direct contact with brain tissue, reflects both normal and pathological CNS processes [2]. However, sensitive and informative methods are required to reliably evaluate CSF properties and distinguish infectious from non-infectious CNS disorders.
Infrared (IR) spectroscopy, especially when applying the attenuated total reflection (ATR) technique, is widely used for the analysis of biological materials, including biological fluids. The ATR-IR method enables rapid recording of IR absorption spectra, which reflect the molecular structure of biomolecules present in the sample, without requiring complex sample preparation. Therefore, this technique is suitable for CSF analysis aimed at identifying spectral differences in order to diagnose the type of CNS disease.
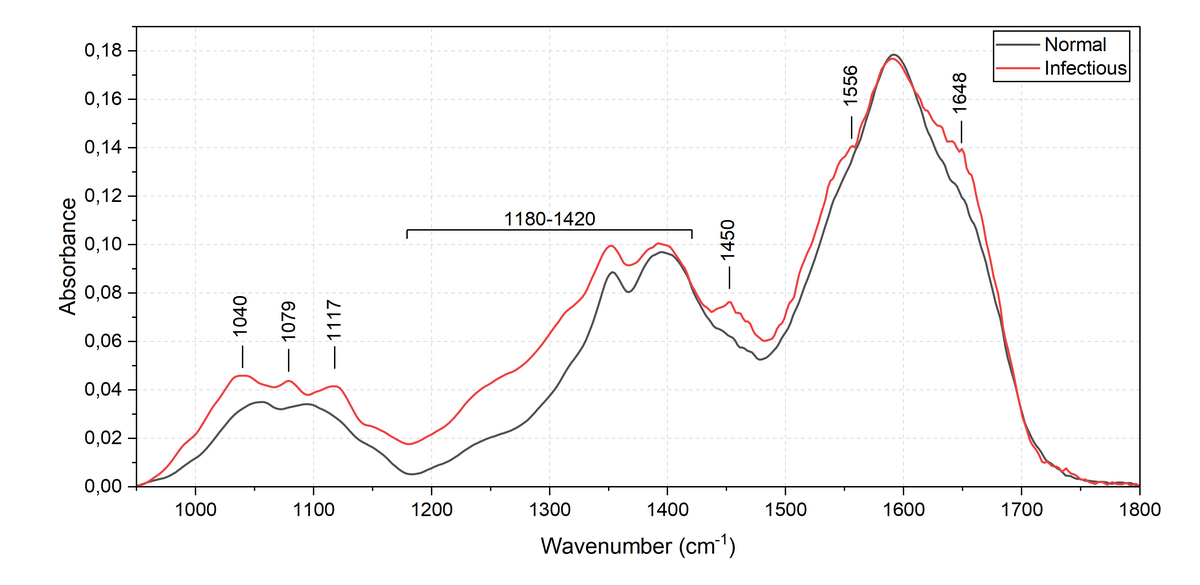
During the study, CSF samples were divided into two groups: normal (13 samples) and infectious (7 samples). To determine the differences between the ATR-IR absorption spectra of the two groups, the averages of all recorded spectra for each group were compared (Fig. 1). As CSF consists of many different components, absorption bands of different compounds may overlap, resulting in complex spectral absorption profiles. For example, at 1648 cm \(^{-1}\) and 1556 cm\(^{-1}\), individual subbands can be separated from the complex band profiles assigned to the amide I and amide II modes of the proteins. The appearance of the Amide I and Amide II bands, indicate an elevated protein concentration during CNS infection. In the spectral region of 1420-1180 cm\(^{-1}\), higher absorption intensity, changes in the spectral contour, and a band at approximately 1450 cm\(^{-1}\) are observed in the infectious CSF spectrum. The spectral bands observed in this region are associated with lipids and proteins; therefore, their changes may be related to inflammatory processes, degradation products of cell membranes and increased protein level. In the 1200-1000 cm\(^{-1}\) region, the spectrum of infectious cerebrospinal fluid shows higher absorption intensity, especially for spectral bands at approximately 1117, 1079 and 1040 cm\(^{-1}\). These bands are associated with phosphates, carbohydrates and lactate; therefore, the higher intensity can be explained by the elevated levels of nucleic acids, phospholipids and glucose metabolism products in infectious CSF, which is characteristic of CNS infections.