Indium gallium nitride (InGaN) is a III-V direct band gap semiconductor made with a mix of InN and GaN materials. First InGaN materials were grown back in 1993 by Nakamura. Since then InGaN LEDs have attracted a lot of attention because of possibility to develop optoelectronic devices emitting from ultraviolet to red region of the electromagnetic spectrum. However, a sharp efficiency drop as indium content is increased still remains a massive issue when trying to manufacture green or red light emitting devices. In fact it is quite surprising that InGaN LEDs are working at all despite their high density of defects. Local indium segregation is responsible for localizing of carriers from defects. In this work the spatial distribution of photoluminescence (PL) is investigated using confocal microscope.
During the research three groups containing different InGaN samples emitting in a wide spectral range were investigated. They either had varying quantum well (QW) thickness (1 – 4 nm) or varying In content (9 – 25 %). Samples were excited with a 405 nm wavelength laser diode through a high numerical aperture (NA = 0.9). PL distributions in 10x10 μm2 (100x100 points) areas in each sample were measured.
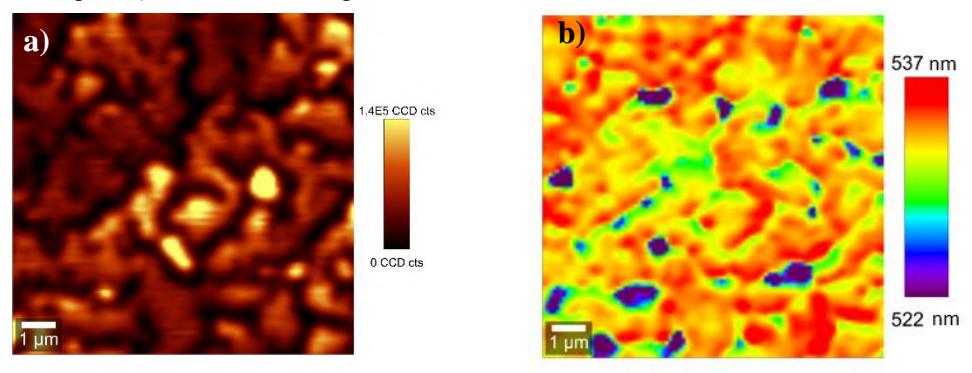
Highly inhomogeneous spatial distributions of PL intensity and peak position typical for InGaN samples were observed and was attributed to localization in the indium rich areas, which isolate carriers from the nonradiative recombination. A redshift of samples PL peak position was observed with increasing indium content due to decreased bandgap. A redshift also was observed in sample group where indium content stayed constant but the quantum well width was changing.
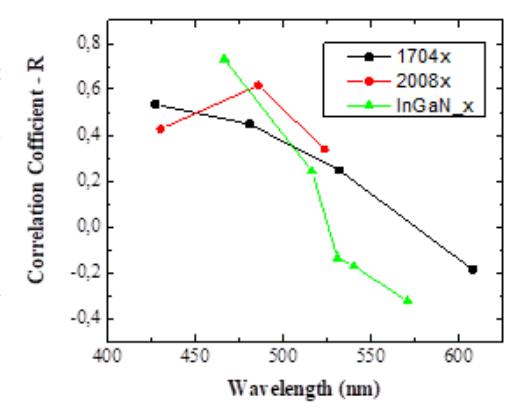
To better characterize samples, correlation coefficient between PL intensity and peak position were calculated (Fig. 2). For samples emitting at shorter wavelengths than ~500 nm, correlation coefficient is positive indicating that higher PL intensity is observed in areas emitting at longer wavelengths. This is in line with localization model. However, for samples with average PL peak wavelength larger than 500 nm correlation coefficient decreases and shifts from positive to negative. Negative values are unexpected and does not agree with localization model. In this work different explanations for this transition were overviewed and discussed, including larger amount of dislocation densities at higher In content regions along with stronger quantum confined Stark effect.