Concentration quenching occurs when fluorescence quantum yield decreases upon increasing concentration of fluorophores in solution. This has been investigated throughout the last century, however, its origin is not fully understood to this day. An example of such occurrence has been observed in chlorophyll solutions: at higher concentrations the relative fluorescence intensity becomes dependent on the concentration and starts decreasing [1]. It is important to note that in artificial systems the fluorescence is usually significantly quenched at fluorophore concentrations typical to that of unquenched in vivo photosynthetic systems.
In this work, concentration quenching was simulated using approach similar to Ref. [2]. In the two-dimensional model molecules, each 1 nm in diameter, were scattered in a 10000 nm2 area using a uniform distribution. Different concentrations were obtained by changing the number of molecules. When two or more molecules were closer to each other than a certain distance (Rtrap), they formed a trap; excitation, after reaching a trap, could not escape. At the initial time moment, excitation was distributed equally among all non-trap molecules. Time dependence of the total excitation probability was calculated by solving the system of kinetic equations with energy transfer rates between the molecules being proportional to the inverse sixth power of the distance between the molecules, following the Förster level of description. The same principle was used in the three-dimensional model, where molecules were scattered uniformly in an 8000 nm3 box. However, the trap formation condition was modified: nearby molecules formed an aggregate which, depending on its type, could become a trap.
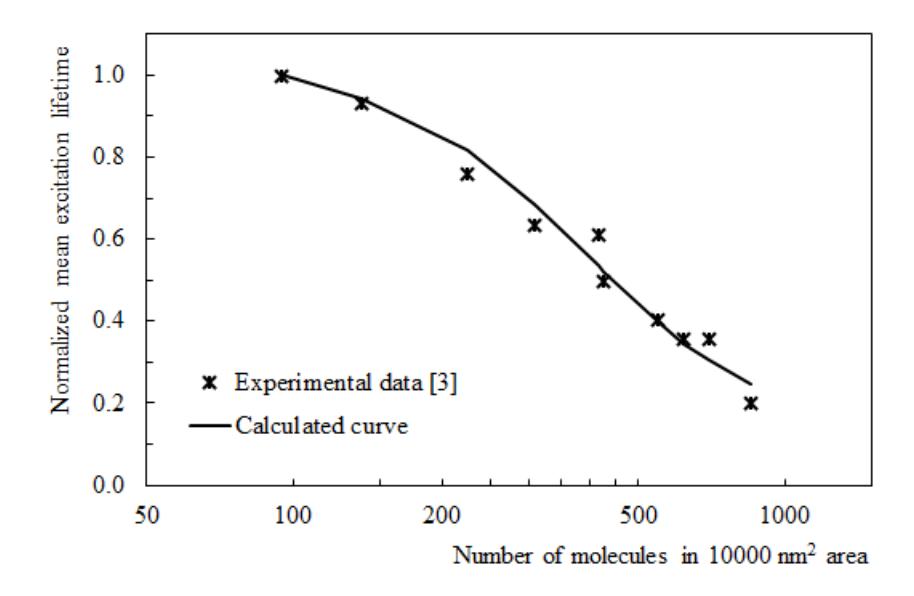
The two-dimensional model was used to fit the measured fluorescence lifetimes of chlorophylls in monolayers at the nitrogen-water interface [3], results are shown in Fig. 1. Fitting was performed by finding the minimal squared deviation between experimental data points and calculated excitation lifetime values in the same concentrations. The three-dimensional model was used to fit the measured chlorophyll fluorescence lifetimes in lipid liposomes [4], however, the current model cannot explain the data sufficiently well, and a more sophisticated model will be presented in the conference.