
Materials and methods. Infrared spectra [1, 2] of diffuse reflection of dry powdered food products were obtained on the spectrometer "Infrapid-61" in the wavelength range from 1330 to 2370 nm.
Several samples of dry food powdered products were selected as the studied objects: bee pollen in natural form; crushed bee pollen; a mixture of bee pollen and powdered sugar. In the general case, depending on the botanical origin of the bee pollen, the infrared spectra of diffuse reflection will undergo some transformations. Bee pollen, based on its functional properties, can be recommended as a natural food ingredient in healthy food preparation [3].
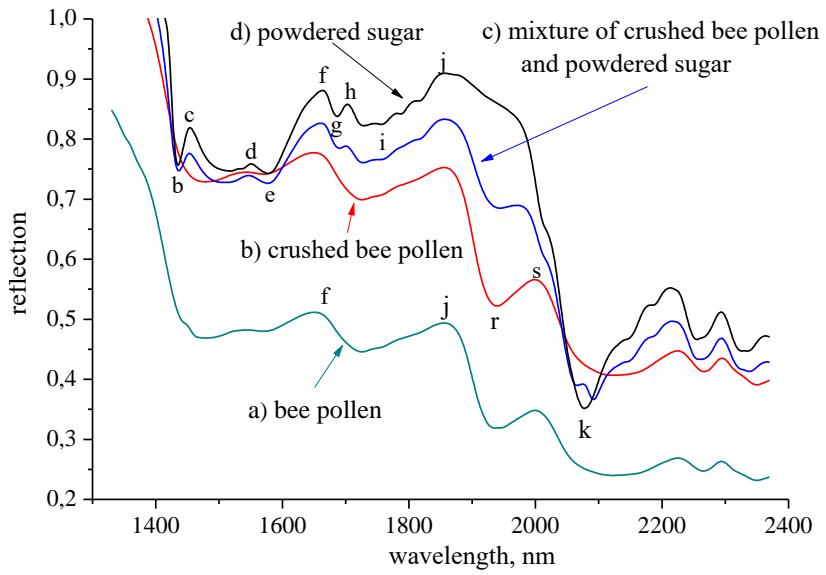
In Fig. 1 presents a typical spectrum of a mixture of powdered sugar and crushed bee pollen, taken in equal proportions (by volume). It should be noted that this spectrum has absorbed the characteristic features of the spectra of crushed bee pollen and powdered sugar. In the spectrum of the mixture of pollen and powdered sugar there is a peculiarity c, which is absent in the spectrum of bee pollen; the spectral maximum s, which is characteristic of pollen, also appeared.
The spectral feature h, characteristic only for powdered sugar, was also manifested in the spectrum of a mixture of powdered sugar and bee pollen. Peculiarity r, present in the spectra of bee pollen and a mixture of powdered sugar with bee pollen, is absent in the spectrum of powdered sugar.
Infrared spectra of all four samples (Fig. 1) differ significantly in the intensity of spectral lines. The most intense spectral maximum corresponds to a wavelength of 1855 nm (feature j). Spectral maxima at the given wavelength are placed in the following sequence (from higher to lower intensity): powdered sugar, a mixture of crushed bee pollen and powdered sugar, bee pollen. In this case, the spectral maxima corresponding to the bee pollination are significantly lower in intensity than other studied samples (Fig. 1).
Conclusions. It is established that the change in the dispersion of the powders does not affect the position of the maxima of the spectral lines. Reducing the particle size of food powder samples by mechanical grinding leads to changes in the infrared reflection spectrum: the maxima of the spectral lines become more pronounced and increase their intensity. Infrared reflection spectra of food mixtures reflect in their structure the characteristic features of the spectra of the powder's constituent components. The intensity of the spectral lines of the ingredients correlates with the component's concentration in the food mixture. The spectra of samples of different chemical nature differ significantly in structure, position of the maxima of spectral lines and intensity. The obtained results can be can be practically applied in the creation and implementation of portable devices that can be used for preliminary qualitative analysis of food products.