In ultrafast lasers it is a hard to maintain extremely short pulse durations, because of the dispersion which the pulse obtains by travelling through space and optical components. Chirped mirrors can be used to compensate this positive dispersion. It is important to know the exact group delay dispersion (GDD) that is created by a chirped mirror. GDD can be measured by white light interferometer (WLI), based on Michelson interferometer, or resonance scanning interferometer (RSI), based on Fabry-Perot interferometer. WLI is the classical choice, but with the RSI it is possible to reach better resolution.
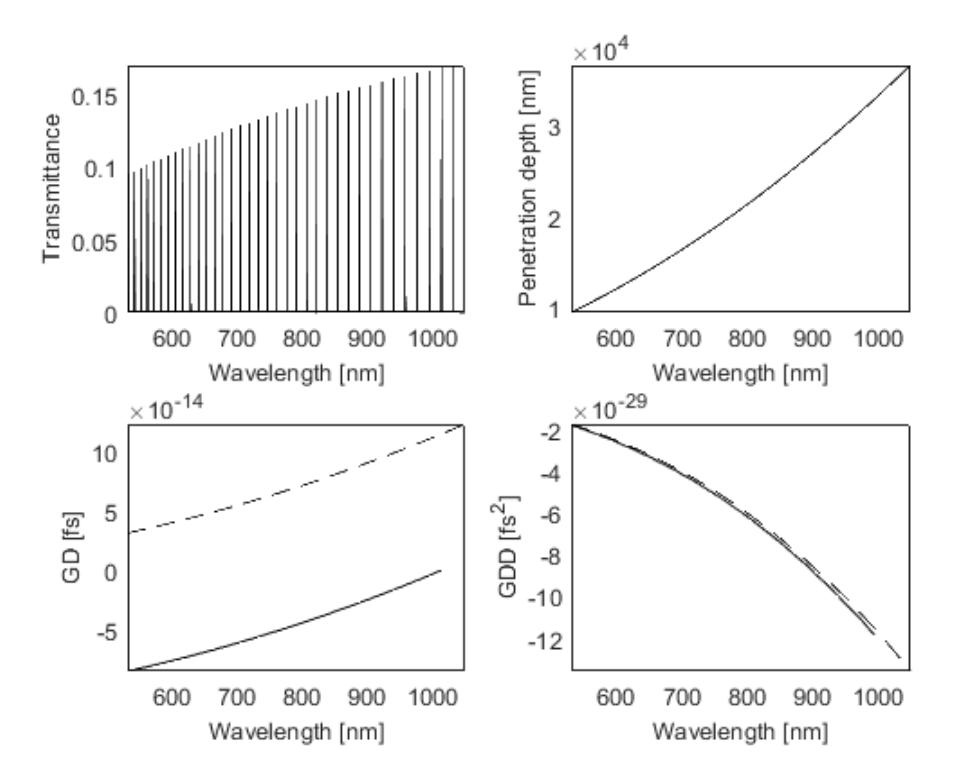
In this work the principles of RSI are examined by creating a theoretical model of RSI and calculating the GD and GDD. The RSI transmittance spectrum consists of spikes at resonant wavelengths. The distance between the resonant frequencies can be related to the average GD within that frequency interval. The GDD is obtained by differentiating GD. This method is limited by the transmittance of the second mirror, the distance between the mirrors and the spectrometer resolution.
The results show, that with a spectrometer resolution of 0.05 nm, signal-to-noise ratio is high enough to distinguish the resonance peaks from noise. It is the optimal resolution because such spectrometer can be easily found in laboratories. The best results can be obtained if the transmittance of the mirror is equal to 0.506%. Then the optimal distance between the mirrors is 10μm. It can be reached experimentally as well. If the distance increases, the intensity of the signal decreases. If the distance between the mirrors is larger (for example, 30μm), a noise occurs in the estimated group delay dispersion.
Theoretical results of a GD and GDD calculated for RSI with such parameters can be seen in Fig. 1.