It is known that atmospheric aerosol particles have adverse effects on human health [1] and impact on climate change [2]. Recent studies show that organic aerosol constitutes a large fraction of total PM1 (particles smaller than 1 μm) mass [3], furthermore, in some cases organic aerosol fraction is dominated by secondary organic aerosol particles [4,5].
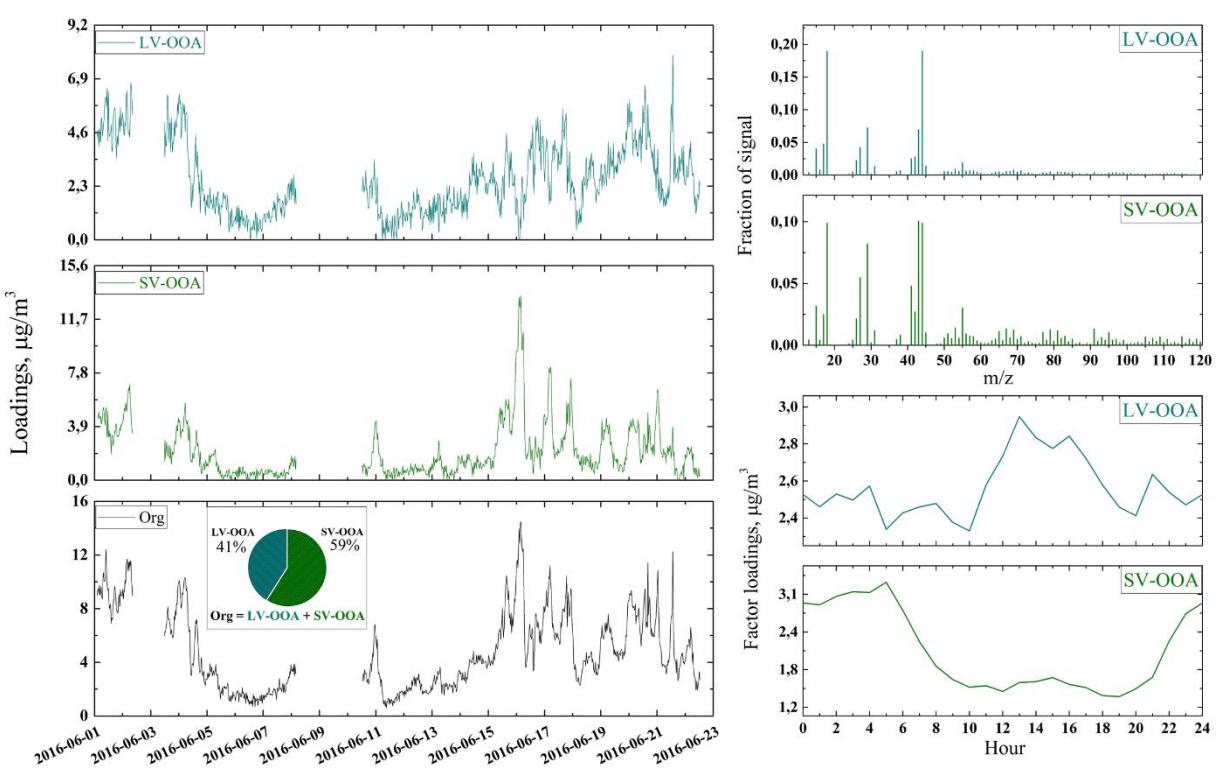
In this study an ACSM (Aerosol Chemical Speciation Monitor, Aerodyne inc.) [6] was used to measure mass-spectral composition of organic non-refractory PM1 (NR-PM1) aerosol. Factor (aerosol source) mass spectra and factor concentration time series (Fig. 1) were reconstructed from measured data by using Positive Matrix Factorization (PMF) - a factor analysis method. ME-2 (Multilinear Engine 2 - a multilinear problem solver software [7]) and SoFi 6.0 (Source Finder, PSI - a graphical user interface for ME-2 data input and visualization [8]) were used to perform PMF analysis of measured data.
The composition of NR-PM1 organic aerosol was measured from 1st to 23rd of June 2016 in Rūgšteliškis, Lithuania (55,46N; 26,00E). The measurement site is a forested area dominated by coniferous trees (>80%). Results of PMF analysis show that no primary organic aerosol (POA) sources had significant impact during measurement period and that NR-PM1 composition were influenced by two secondary organic (SOA) aerosol sources – low volatility oxygenated organic aerosol (LV-OOA) and semi-volatile OOA (SV-OOA). The former factor (source) represents aged regional aerosol and the latter factor is interpreted as fresher, newly formed secondary aerosol particles [4,5]. The presence (59%) of SV-OOA factor indicates that a significant amount of organic aerosol is formed locally. These findings suggest that during the measurement period main precursor of SOA was plant-emitted biogenic volatile organic compounds.