
Drought is one of the natural hazards which impacts agriculture, crop production and water management. It become more relevant not only in arid, but also in humid areas like the Baltic Sea basin. Drought assessment and analysis reduces its devastating impact in vulnerable regions [1]. For this reason droughts receive more political attention. For its assessment, adaptation and decision-making, first of all objective information about droughts' frequency, spread in area and impact on the state of vegetation cover is needed. Vegetation cover quantity and quality depends on the surface temperature, soil moisture, water vapour content, accumulated rainfall and atmospheric pollution [2].
Nowadays the analysis of drought includes various indexes, based on meteorological parameters. Meteorological stations' data have poor spatial resolution of parameters. Satellite information could be powerful tool to improve the analysis of vegetation condition analysis and drought assessment.
Satellite information can help to identify vegetation conditions thought reflected red (R) and near-infrared (NIR) spectrum waves, used in the vegetation index, like NDVI (Normalized Difference Vegetation Index), calculations. NDVI shows vegetation colour (1) and vary from 0.1 (no vegetation) till 1.0 (perfect greenness vegetation):
$$NDVI = (NIR-R) / (NIR+R)\tag{1}$$Also NDVI analysed by VCI (Vegetation Condition Index), which compares the current and previous years' NDVI values (2). VCI values vary from 0 to 100, where less than 40 could be an indication of drought [3].
$$VCI = ((NDVI - NDVI_{min}) / (NDVI - NDVI_{max})) \times 100\tag{2}$$In this study NDVI was used as detected by AVHRR (Advanced Very High Resolution Radiometer) onboard NOAA satellites in 1982-2014. The period of analysis is from May to September. Land cover data was identified using CORINE data sets. SPI (Standard Precipitation Index) from 1 to 24 months was used for moisture conditions. SPI values between -1 and +1 means normal, but less than -1 (more than +1) shows precipitation deficit (excess).
The best vegetation found in June and July and poorest – in September. Vegetation is most stable in summer but more varying in May and September because of a number of factors affecting start ant end of vegetation season.
Different land use has uneven NDVI distribution. In the middle of June maximum NDVI observed in arable lands, one week later in pastures and in coniferous, broad-leaved forests and wetlands in the beginning of July. It was found that date of maximum NDVI in arable land becomes 1.5 day earlier every 10 years, but in coniferous and pastures - 0.3 day.
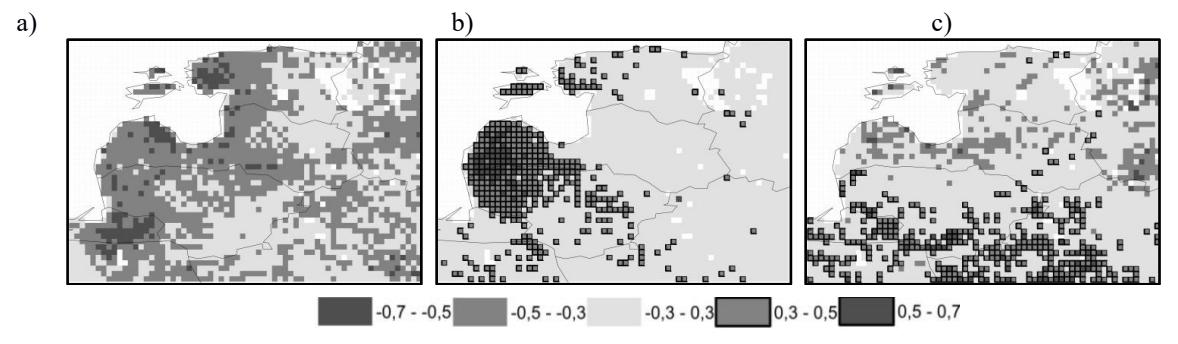
Area is non-homogenous either in NDVI spatial distribution (vegetation depends on relief and distance from the sea), or in vegetation relation with SPI. It was found that VCI and SPI1 have a negative correlation in all areas. Strongest relation was found in May, when more precipitation determine worse vegetation, because soil still has enough moisture after spring snowmelt (Fig. 1a).
In other months, same monthly precipitation does not lead to better vegetation also. VCI and longer time SPI (SPI6, SPI9, SPI12, SPI24) have positive correlation in western Lithuania and Latvia, so these areas' vegetation depends on longer precipitation regime and is better with more moister conditions (Fig. 1b).
In summertime VCI and SPI1, SPI2 has negative correlation in northern part and positive – in southern (Fig. 1c). For this reason, area is divided into two parts, depending on main dominant parameter: northern (temperature and vegetation conditions are better when there are less precipitation) and southern (vegetation state is better when there is more moisture).