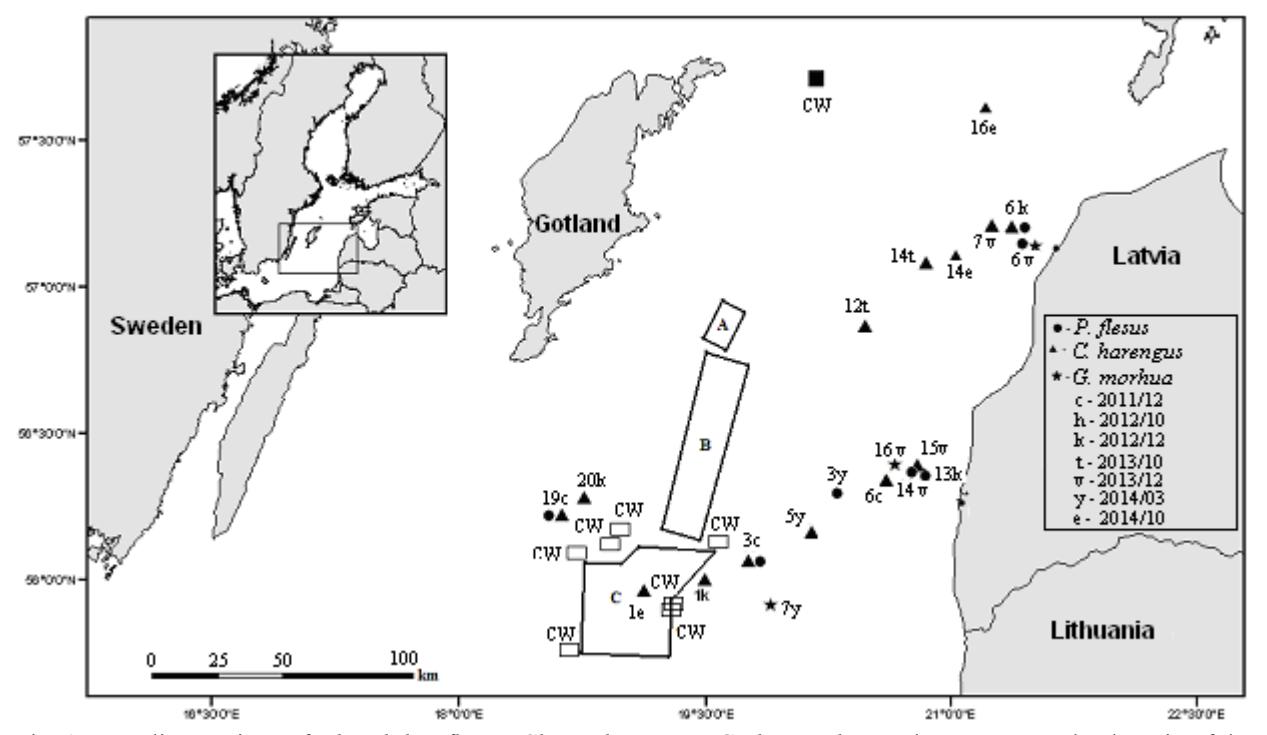
Environmental genotoxicity was investigated in blood erythrocytes of flounder (Platichthys flesus), herring (Clupea harengus) and cod (Gadus morhua) specimens, which were collected at 20 stations located in the Eastern Gotland basin of the Baltic Sea, during 2011 – 2014 period (Fig. 1). The induction of micronuclei (MN), nuclear buds (NB), nuclear buds on filament (NBf), bi-nucleated erythrocytes with nucleoplasmic bridges (BNb) and blebbed (BL) nuclei in peripheral blood erythrocytes was evaluated as genotoxicity endpoints.
According to the results, the frequencies of analysed nuclear abnormalities have decreased during 2011-2013 period and increased in 2014. During the 2011-2014 period of the investigation, the highest frequency of MN (12.05 ‰) was detected in C. harengus from station 1e in 2014. This station is located in the centre of the chemical munitions dumpsite C (Fig. 1). In 2011, there were determined the highest frequencies of all other nuclear abnormalities. The frequency of NB reached 1.25 ‰, NBf – 1.80 ‰ level in blood erythrocytes of C. harengus collected from the station 19c. Meanwhile, nuclear abnormalities such as BL (1.65 ‰) and BNb (0.13 ‰) were detected in P. flesus caught at study stations 3c and 19c, respectively. Stations 3c and 19c are located approximately about 15 km from an official chemical munitions dumpsite C. There are known CW agent findings to west-south direction from the dumpsite C.
Induction of genotoxicity responses was higher in C. harengus than in P. flesus, while, the lowest responses were found in G. morhua. There were detected statistically significant interspecific differences between frequencies of the analysed endpoints NB ($p$=0.0481), NBf ($p$=0.005) in flounder and herring caught from the same station 19c. Statistically significant differences were found between these two species consider BL ($p$=0.0463) in station 3c, NB ($p$=0.0015) and BL ($p$=0.0232) frequencies in specimens caught at station 6k.
The analysis of MN induction revealed that fish sampled from 1e, 19c, 3c, 14e, 16e, 6k, 3y, 20k, 13k stations have attributed to extremely high genotoxicity risk levels. MN frequencies in 80–100 % of flounder specimens, collected inform the study stations (3c, 19c, 3y); were higher than the background level (P90). For herring, extremely high genotoxicity risk levels were determined in stations 1e and 14e. Low genotoxicity risk levels were assessed for all three fish species sampled only in two investigated stations (6v and 7v).