
GaAsBi and related III–V alloys are referred to as bismides. They hold promise for use in laser diodes due to reduced Auger recombination and weaker emission wavelength sensitivity on temperature; also in multi-junction solar cells, and photoconductive THz range components activated by long wavelength laser pulses. To realise such applications good knowledge of band structure parameters is needed. Terahertz emission spectroscopy (TES) is novel technique for subsidiary valley and conduction band offset determination.
Terahertz radiation (THz) emission from semiconductor surfaces was demonstrated by Auston group[1]. Since the surface THz emission is a universal phenomenon in semiconductors, THz time domain spectroscopy can also be used as a characterization tool of these materials. Two main mechanisms of THz emission from femtosecond laser excited semiconductor surfaces are the photocurrent surge in the surface electric field and the spatial separation of more mobile photoexcited electrons and less mobile holes at the surface (the photo-Dember effect). The photocurrent surge effect provides the information on the energy band-bending at the crystal surface, whereas nearly monoenergetic electron bunches excited by femtosecond laser pulse and ballistically propagating towards the bulk can be exploited for studying the details of the electron energy band structure. Characteristic features on TES spectra are peaks at a semiconductor band gap, due to electric field, and peaks, due to inter-valley scattering [2].
In this work, we determined GaAs1-xBix/GaAs heterojunction offsets by varying Bi content from 3 to 12 % in measured samples. 100 nm GaAsBi samples were grown on semi-insulating GaAs by molecular beam epitaxy. Thin layers are chosen so there is uniform carrier distribution. Because of it there is no THz generation until electrons can pass through conduction band barrier. When that threshold is reached electrons are separated from holes to the GaAs substrate and THz emission occurs [3]. This effect is clearly seen in TES spectras (fig. 1) where THz emission is starting at higher photon energy than bandgap energy determined from photoluminescence measurements. Theoretical THz emission onset was fitted to the measured spectra. Conduction band and valence band offset ratio did not change with Bi content and was ~0.45.
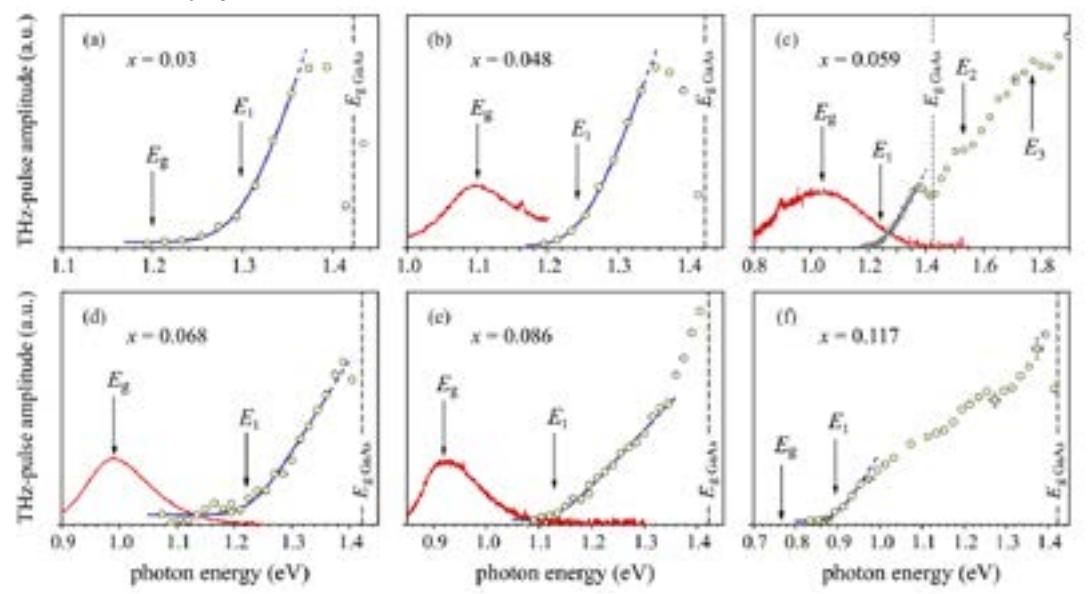
Main advantage of this technique is a direct relation between the offset values and features in TES spectra. Also it is a contactless method which does not require complicated sample structures. Resolution is limited by exciting laser bandwidth and sensitivity of THz emission setup.