
Ethanol molecules are interesting objects to be investigated. In particular, because of the formation of the intermolecular hydrogen bonds, they are forming clusters, they exist in the form of two conformers and their energy is only 40 cm-1 apart. Besides, there are two internal rotors in the ethanol molecule. Ethanol molecule torsion spectra were registered both at the room temperature and at the low temperature in the matrix isolation. Thus, it is of interest to calculate the ethanol molecule torsion spectra at the different temperatures. The energy of torsion states was calculated at the B3LYP-D3/acc-pVQZ level of theory. Simultaneously, 2D surface of the dipole momentum and partition function for different temperatures were calculated. Lorentz contours with the half-width equals to 1 cm-1 were used for the modeling of the torsion IR spectra. Fig. 1 and 2 are presenting the calculated torsion IR spectra of the ethanol at T= 300 K (Fig.1) and T=20 K (Fig.2).
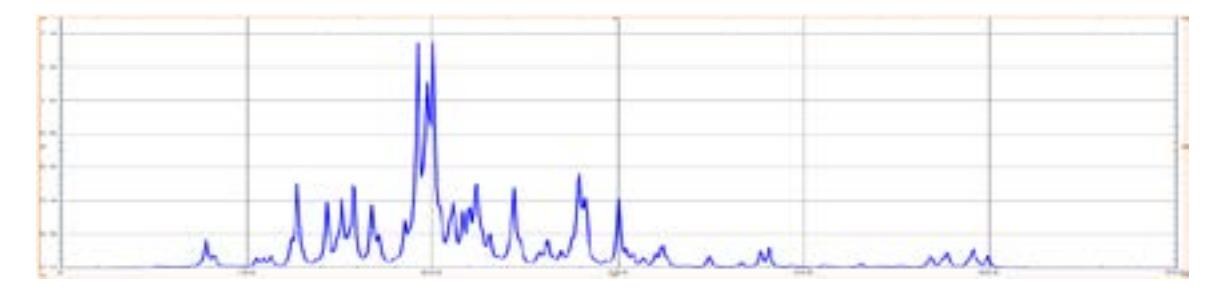
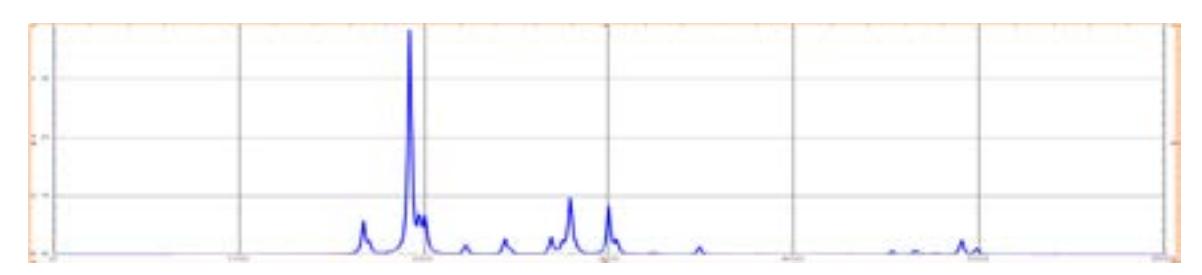
During the calculations of the ethanol low temperature torsion spectrum, the fact that gosh- and trans- conformers of the molecule are separated with significant potential barriers and, therefore, even at low temperatures the number of gosh-conformers are twice as big as the number of trans- conformers, was taken into account. Comparison of the Fig. 1 and 2 leads to the conclusion that with the decreasing of the temperature, torsion spectrum of the ethanol molecule become significantly less complicated. It is obvious that torsion spectrum of the ethanol molecule in matrix isolation should be compared to the spectrum, presented in the Fig. 2, and gas phase spectrum – with the spectrum from the Fig. 1.