The Atlantic cyclones have the highest influence on the most episodes of severe weather in the Baltic region. In Lithuania, the maximum intensity of wind gusts is reached when the trajectory of cyclone is a bit further to the north, moving from the ocean towards Scandinavia and Russia. The cold period (late autumn-early spring) is the most preferable time this type of phenomena to occur.
The presentation demonstrates the case of 11 January, 2015. The severe weather event was selected to illustrate the prediction and development of the very powerful cyclone, called "Felix" which brought to Lithuania very strong wind (28–31 m/s), sleet, snow, freezing rain and even thunderstorm in the western part of the country (Fig. 1).
Forecasters at Lithuanian HMS mainly use global numerical weather prediction (NWP) model from European Center for Medium-Range Weather Forecasts (ECMWF), local model HIRLAM and global model ICON13 from German Weather Service (DWD). In this situation models were very successful (especially 10 m wind speed extreme forecast index, probability of wind gusts >25m/s). As a result, high wind gusts warning was issued 36 hours in advance.
The presence of the jet stream, temperature advection, cross sections of isentrops, the advection of positive upper level potencial vorticity anomaly downward to the mid-troposhere and tropopause dynamic anomaly were investigated using of the ECMWF and HIRLAM models.
| T (°C) 850 hPa | T (°C) 500 hPa | Jet stream (m/s) at 300 hPa height | CAPE (J/kg) | Indexes of instability (Lifted and Showalter) | PV=1 height (hPa) | Positive vorticity advection PVA | Condensation level LCL (hPa) | Free convection level LFC (hPa) |
|---|---|---|---|---|---|---|---|---|
| -5 | -35 | 50–60 | 100 | LI=1; SSI=3 | ~500 | ~1 | 896 | 833 |
This paper focuses on the case study where very strong wind and other phenomena were used to demonstrate usefullness not only NWP models but also satellite data for analysis of pre-storm conditions, characterization of atmospheric layers and nowcasting future storm behaviour.
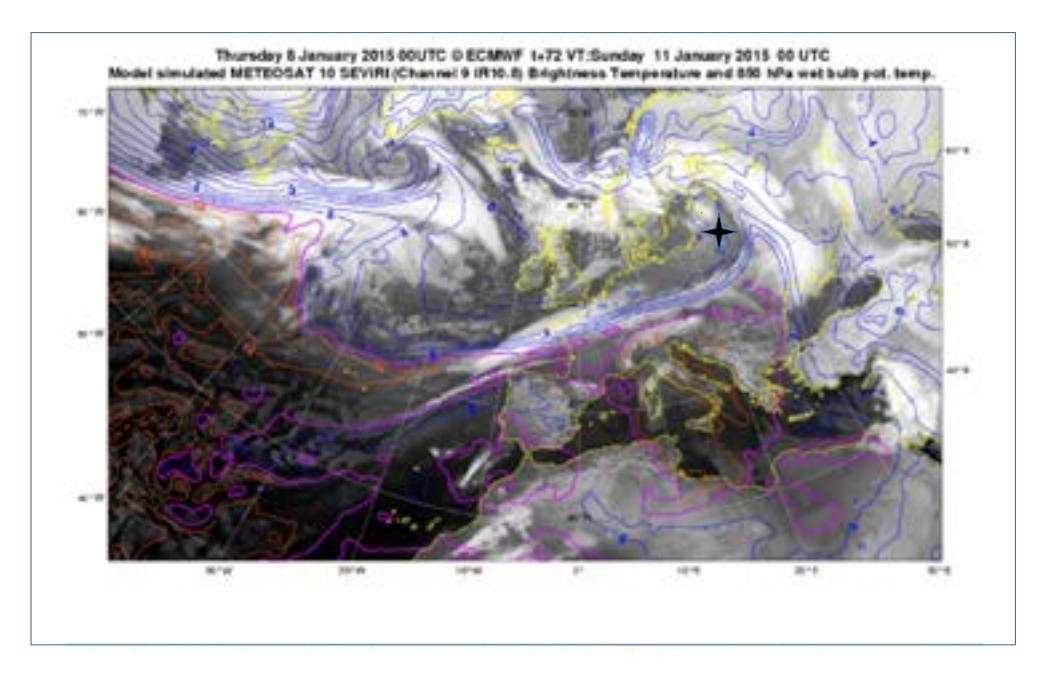
Different MSG satellite products, such as Water Vapour (WV6.2), Air Mass RGB, Infrared (IR10.8), pseudo satellite images including the layers of the atmospheric physical parameters (Fig. 2) helped to predict extremly dangerous phenomena precisely. The analysis of situation is widely illustrated in the presentation.