
SnS is attractive material for solar cells application because of its interesting physical and photovoltaic properties [1]. In this work the optical properties of SnS films were studied by photoacoustic spectroscopy. The bandgaps of SnS thin films were calculated from their photoacoustic spectra as well as spectral dependencies of absorption coefficients.
Photoacoustic spectroscopy is a sensitive method for investigating optical properties of semiconductors [2] both amorphous and crystalline. The method is also non-destructive [3].
SnS films were obtained by chemical bath deposition. The photoacoustic spectra were measured in the range of wavelengths of 500-1500 nm using Halogen Lamp (240W) at a constant frequency of modulation (770 Hz). The electrets microphone with a low noise preamplifier was used for detection of the photoacoustic signal. The obtained photoacoustic signal was calibrated using spectrum of glassy carbon.
The normalized photoacoustic amplitude was considered as:
$$q = \frac{P}{P_{sat}}\tag{1}$$where P – is gas pressure inside of photoacoustic cell, Psat – is gas pressure inside of photoacoustic cell for the big value of optical absorption coefficient [4].
Calculated spectra of normalized photoacoustic amplitude are presented on figure 1.
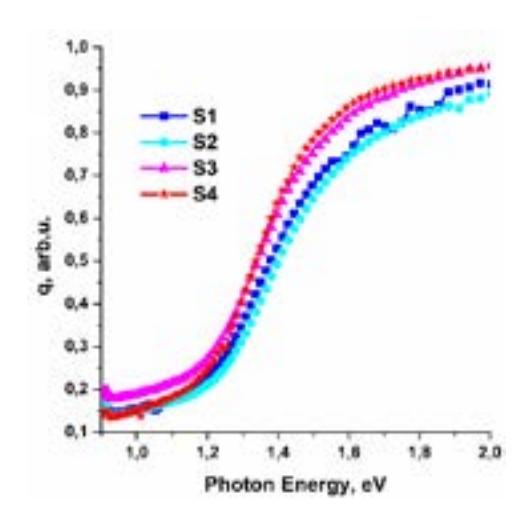
The values of optical absorption coefficients $\alpha$ were obtained according to the formula below [4]:
$$-\ln(1-q) = \alpha d\tag{2}$$where d – is thickness of SnS film.
The values of bandgap (Eg) were obtained graphically. SnS – direct gap semiconductor [1] that means Eg values can be obtained by linear range extrapolation of $(\alpha h \nu)^2$ spectral dependency to the intersection with the x-axis. The calculated Eg values are 1.34 eV, 1.52 eV, 1.30 eV, 1.42 eV for S1, S2, S3 and S4 samples respectively.
This paper shows the photoacoustic spectroscopy is well appliable for SnS films investigation and can be useful for their further research.