
Increasing energy consumption and changing people attitude towards more sustainable energy calls for new ways how to produce and store electricity [1]. One of the alternatives is the use of aqueous Na-ion batteries due to their low cost, environmental friendliness and durability. However, water based electrolytes suffer due to the limited electrochemical window of water and limited electrode material stability [1, 2].
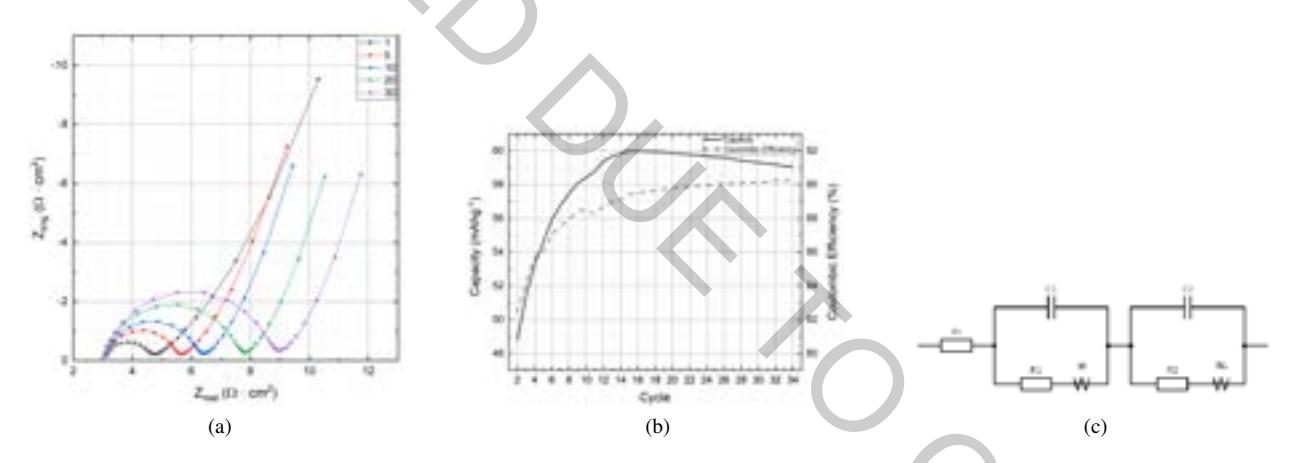
The main goals of this study are to choose and investigate the effects of cell type and geometry to the Electrochemical Impedance Spectroscopy (EIS) measurements, record the EIS spectra of a negative Na-ion battery electrode during the galvanostatic charge/discharge cycling, fit the data using the equivalent circuit model and analyze the results in terms of electrode degradation mechanisms [3]. All the studied electrodes were developed in house using the NASICON-structured Na3Ti2(PO4)3 as active material and 1M Na2SO4(aq.) as electrolyte. All measurements were conducted at room temperature.
In the simulation an equivalent electrical circuit is used in order to fit the EIS results (Fig. 1). The data presented in Table 1 show the increase in one of the resistances ($R_1$) upon cycling, which correlates directly with the shrinking electrode charge capacity. This indicates the electrode degradation process caused by such processes as electrode material dissolution and subsequent deposition of certain blocking layer or corrosion of electrode component due to water decomposition reactions taking place. Nevertheless, the Coulombic efficiency does not deteriorate but actually increases with cycle number indicating a certain stabilization and corrosion inhibition processes.
| Cycle No. | $R_t$ | $C_1$ | $R_1$ | W | $C_2$ | $R_2$ | Wor | Woc |
|---|---|---|---|---|---|---|---|---|
| $\Omega{\cdot}cm^2$ | F/cm2 | $\Omega{\cdot}cm^2$ | $\Omega \cdot \text{cm}^2/\text{s}^{1/2}$ | F/cm2 | $\Omega{\cdot}cm^2$ | $\Omega \cdot \text{cm}^2/\text{s}^{1/2}$ | s1/2 | |
| 1 | 3,15 | $1,29 \cdot 10^{-4}$ | 0,43 | 3,69 | $6,83 \cdot 10^{-6}$ | 1,32 | 0,90 | 0,52 |
| 5 | 3,12 | $7,64 \cdot 10^{-5}$ | 0,77 | 2,74 | $8,53 \cdot 10^{-6}$ | 1,65 | 0,79 | 0,48 |
| 10 | 3,11 | $4,56 \cdot 10^{-5}$ | 1,37 | 2,34 | $9,34 \cdot 10^{-6}$ | 1,77 | 0,78 | 0,49 |
| 20 | 3,08 | $2,81 \cdot 10^{-5}$ | 2,74 | 2,13 | $1,16 \cdot 10^{-5}$ | 1,74 | 0,89 | 0,57 |
| 30 | 3,07 | $2,57 \cdot 10^{-5}$ | 3,74 | 2,20 | $1,26 \cdot 10^{-5}$ | 1,82 | 1,04 | 0,68 |