
In the last decade scientific field researching microscopic optical sensors has rapidly emerged. Optical sensors offer high sensitivity as well as non-invasive sensing methods. There are many possible sensing mechanisms but those based on monitoring wavelength shift, are one of the most common. In this paper we show how Lissajous figures can be used as data processing method and demonstrate this method in action as a part of novel optical humidity sensor.
We used transparent microsphere resonators which due to total internal reflection can trap light inside them, thus constructive interference can occur. This process is also known as whispering gallery modes (WGM). Our optical relative humidity (RH) sensor mainly consisted of liquid glycerol microdroplet acting as microsphere resonator, 760 nm tunable VCSEL laser, detector and oscilloscope. Experiments with glycerol microdroplet showed that clear fundamental modes can be excited (Fig. 1a) and glycerol by its nature is great material for humidity sensing as it is hygroscopic, non-toxic, non-irritating, stable, viscose. For every RH level microdroplet has got exact diameter and refractive index. If RH changes in the surrounding environment, resonance conditions for the microdroplet changes and one can observe rapid wavelength shift in the transmission spectrum. In fact, sensitivity of the glycerol microdroplet sensor is so high, that up to 25 resonant peaks crossed the oscilloscope screen for change of 1 % RH. To make use of such properties Lissajous figures were introduced into data processing algorithm. Intensity at points I1(X1) and I2(X2) (Fig. 1a) from transmission spectrum was continuously recorded and Lissajous figure could be created in real time (Fig. 1b). When RH conditions changed, resonant modes were shifting to longer wavelengths if RH increased and vice versa. By knowing whether the wavelength of resonant modes increased or decreased and for how much, precise RH change could be determined.
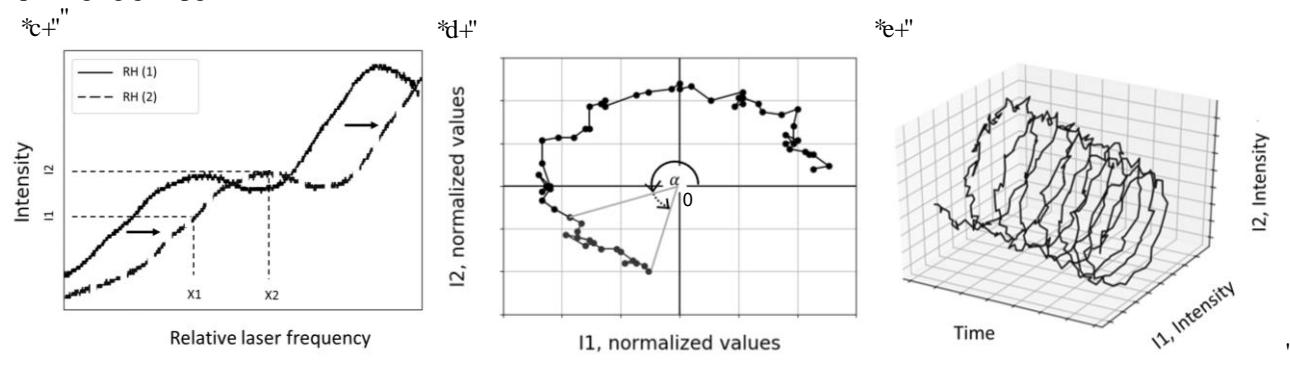
Each point shown in Fig. 1b has directly measured coordinates (normalized I1 and I2 values). Using simple trigonometry one can determine what angle a radius vector would have as shown in Fig. 1b. A shift of 360° is equal to wavelength shift of free spectral range. This allows us to measure wavelength shift in real time despite unordinary mode shift where up to 300 modes can cross the oscilloscope screen within an hour.
The data processing method presented in this paper can be useful for optical sensors where one has to deal with high sensitivity and use of tunable lasers. This methodology is also promising for microresonator sensors with lower Q-factors (Q-factor of the resonator used in this work was 104). Constructing Lissajous figures as shown in Fig. 1 require minimal capacity to process data as only 2 data points are needed for each measurement which greatly simplifies the process of measuring wavelength shift. This study discusses the full process of Lissajous figures based data processing and benefits of it.